An old story that is not yet solve.
Why this article.
Some time ago I had open a bug report to codership through Seppo.
The report was about the delay existing in executing data load with FK. (https://bugs.launchpad.net/codership-mysql/+bug/1323765).
The delay I was reporting at that time were such to scare me a lot, but I know talking with Alex and Seppo that they were aware of the need to optimize the approach an some work was on going.
After some time I had done the test again with newer version of PXC and Galera library.
This article is describing what I have found, in the hope that share information is still worth something, nothing less nothing more.
The tests
Tests had being run on a VM with 8 cores 16GB RAM RAID10 (6 spindle 10KRPM).
I have run 4 types of tests:
- Load from file using SOURCE and extended inserts
- Load from SQL dump and extended inserts
- Run multiple threads operating against employees tables with and without FK
- Run single thread operating against employees tables with and without FK
For the test running against the employees’ db and simulating the client external access, I had used my own stresstool.
The tests have been done during a large period of time, given I was testing different versions and I had no time to stop and consolidate the article. Also I was never fully convinced, as such I was doing the tests over and over, to validate the results.
I have reviewed version from:
Server version: 5.6.21-70.1-25.8-log Percona XtraDB Cluster binary (GPL) 5.6.21-25.8, Revision 938, wsrep_25.8.r4150
To
Server version: 5.6.24-72.2-25.11-log Percona XtraDB Cluster binary (GPL) 5.6.24-25.11, Revision, wsrep_25.11
With consistent behavior.
What happened
The first test was as simple as the one I did for the initial report, and I was mainly loading the employees db in MySQL.
time mysql -ustress -ptool -h 127.0.0.1 -P3306 < employees.sql
Surprise surprise … I literally jump on the chair the load takes 37m57.792s.
Yes you are reading right, it was taking almost 38 minutes to execute.
I was so surprise that I did not trust the test, as such I did it again, and again, and again.
Changing versions, changing machines, and so on.
No way… the time remain surprisingly high.
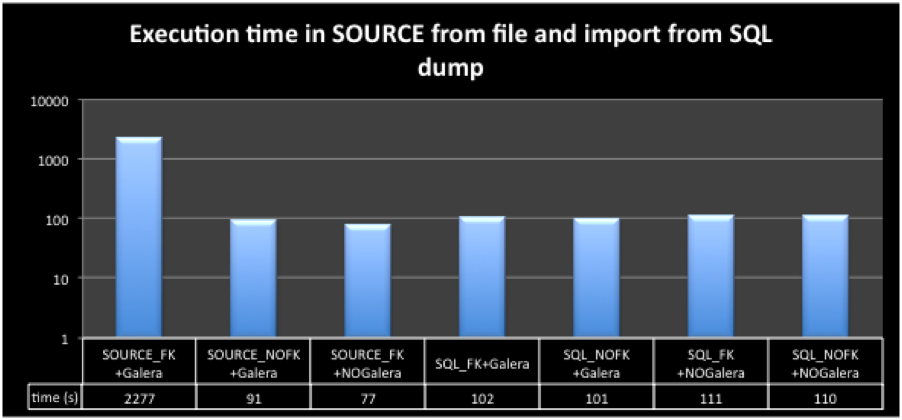
Running the same test but excluding the FK and using galera was complete in 90 seconds, while with FK but not loading the Galera library 77 seconds.
Ok something was not right. Right?
I decide to dig a bit starting from analyzing the time taken, for each test.
See image below:

From all the tests the only one not align was the data loading with FK + Galera .
I had also decided to see what was the behavior in case of multiple threads and contention.
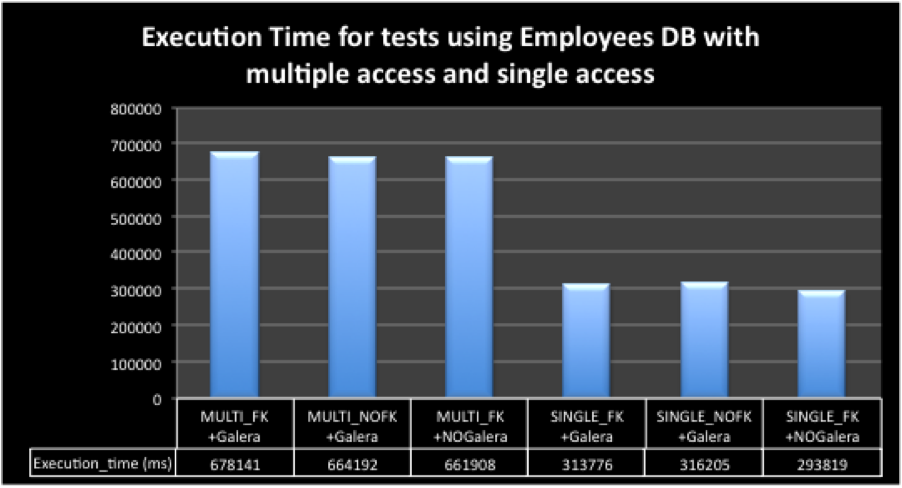
As such I prepare a test using my StressTool and run two class of tests, one with 8 threads pushing data, the other single threaded.
As usual I have also run the test with FK+Galera, NOFK+Galera, FK+No Galera.
The results were what I was expecting this time and the FK impact was minimal if any, see below:

The distance between execution was minimal and in line with expectations.
Also it was consistent between versions, so no surprise, I relaxed there and I could focus on something else.
On what?
Well why on the case of the load from file, the impact was so significant.
The first thing done was starting to dig on the calls, and what each action was really doing inside MySQL.
To do so I have install some tools like PERF and OPROFILE, and start to dig into it.
First test with FK+Galera taking 38 minutes, was constantly reporting a different sequence of calls/cost from all other tests.
57.25% [kernel] [k] hypercall_page
35.71% libgcc_s-4.4.7-20120601.so.1 [.] 0x0000000000010c61
2.73% libc-2.12.so [.] __strlen_sse42
0.16% mysqld [.] MYSQLparse(THD*)
0.14% libgcc_s-4.4.7-20120601.so.1 [.] strlen@plt
0.12% libgalera_smm.so [.] galera::KeySetOut::KeyPart::KeyPart(galera::KeySetOut::KeyParts&, galera::KeySetOut&, galera::K
0.12% mysqld [.] btr_search_guess_on_hash(dict_index_t*, btr_search_t*, dtuple_t const*, unsigned long, unsigned
0.09% libc-2.12.so [.] memcpy
0.09% libc-2.12.so [.] _int_malloc
0.09% mysqld [.] rec_get_offsets_func(unsigned char const*, dict_index_t const*, unsigned long*, unsigned long,
0.08% mysql [.] read_and_execute(bool)
0.08% mysqld [.] ha_innobase::wsrep_append_keys(THD*, bool, unsigned char const*, unsigned char const*)
0.07% libc-2.12.so [.] _int_free
0.07% libgalera_smm.so [.] galera::KeySetOut::append(galera::KeyData const&)
0.06% libc-2.12.so [.] malloc
0.06% mysqld [.] lex_one_token(YYSTYPE*, THD*)
Comparing this with the output of the action without FK but still with Galera:
75.53% [kernel] [k] hypercall_page
1.31% mysqld [.] MYSQLparse(THD*)
0.81% mysql [.] read_and_execute(bool)
0.78% mysqld [.] ha_innobase::wsrep_append_keys(THD*, bool, unsigned char const*, unsigned char const*)
0.66% mysqld [.] _Z27wsrep_store_key_val_for_rowP3THDP5TABLEjPcjPKhPm.clone.9
0.55% mysqld [.] fill_record(THD*, Field**, List<Item>&, bool, st_bitmap*)
0.53% libc-2.12.so [.] _int_malloc
0.50% libc-2.12.so [.] memcpy
0.48% mysqld [.] lex_one_token(YYSTYPE*, THD*)
0.45% libgalera_smm.so [.] galera::KeySetOut::KeyPart::KeyPart(galera::KeySetOut::KeyParts&, galera::KeySetOut&, galera::K
0.43% mysqld [.] rec_get_offsets_func(unsigned char const*, dict_index_t const*, unsigned long*, unsigned long,
0.43% mysqld [.] btr_search_guess_on_hash(dict_index_t*, btr_search_t*, dtuple_t const*, unsigned long, unsigned
0.39% mysqld [.] trx_undo_report_row_operation(unsigned long, unsigned long, que_thr_t*, dict_index_t*, dtuple_t
0.38% libgalera_smm.so [.] galera::KeySetOut::append(galera::KeyData const&)
0.37% libc-2.12.so [.] _int_free
0.37% mysqld [.] str_to_datetime
0.36% libc-2.12.so [.] malloc
0.34% mysqld [.] mtr_add_dirtied_pages_to_flush_list(mtr_t*)
What comes out is the significant difference in the FK parsing.
The galera function
KeySetOut::KeyPart::KeyPart (KeyParts& added,
KeySetOut& store,
const KeyPart* parent,
const KeyData& kd,
int const part_num)
is the top consumer before moving out to share libraries.
After it the server is constantly calling the strlen function, as if evaluating each entry in the insert multiple times.
This unfortunate behavior happens ONLY when the FK exists and require validation, and ONLY if the Galera library is loaded.
It is logic conclusion that the library is adding the overhead, probably in some iteration, and probably a bug.
Running the application tests, using multiple clients and threads, this delay is not happening, at least with this level of magnitude.
During the application tests, I had be using batching insert up to 50 insert for SQL command, as such I could have NOT trigger the limit, that is causing the issue in Galera.
As such, I am not still convinced that we are “safe” there and I have in my to do list to add this test soon, in the case of significant result I will append the information, but I was feeling the need to share in the meanwhile.
The other question was, WHY the data load from SQL dump was NOT taking so long?
That part is easy, comparing the load files we can see that in the SQL dump the FK and UK are disable while loading, as such the server skip the evaluation of the FK in full.
That’s it, adding:
SET FOREIGN_KEY_CHECKS=0, UNIQUE_CHECKS=0;
To the import and setting them back after, remove the delay and also the function calls become “standard”.
Conclusions
This short article has the purpose of:
- Alert all of you of this issue in Galera and let you know this is going on from sometime and has not being fix yet.
- Provide you a workaround. Use SET FOREIGN_KEY_CHECKS=0, UNIQUE_CHECKS=0; when performing data load, and rememeber to put them back (SET FOREIGN_KEY_CHECKS=1, UNIQUE_CHECKS=1;).
Unfortunately, as we all know, not always we can disable them, Right? This brings us to the last point. - I think that Codership and eventually Percona, should dedicate some attention to this issue, because it COULD be limited to the data loading, but it may be not.
I have more info and oprofile output that I am going to add in the bug report, with the hope it will be processed.
Great MySQL to everyone …