Understand dirty reads when using ProxySQL
Recently I had been asked to dig a bit about WHY some user where getting dirty reads when using PXC and ProxySQL.
While the immediate answer was easy, I had taken that opportunity to dig a bit more and buildup a comparison between different HA solutions.
For the ones that cannot wait, the immediate answer is …drum roll, PXC is based on Galera replication, and as I am saying from VERY long time (2011), Galera replication is virtually synchronous. Given that if you are not careful you MAY hit some dirty reads, especially if configured incorrectly.
There is nothing really bad here, we just need to know how to handle it right.
In any case the important thing is to understand some basic concepts.
Two ways of seeing the world (the theory)
Once more let us talk about data-centric approach and data-distributed.
We can have one data state:
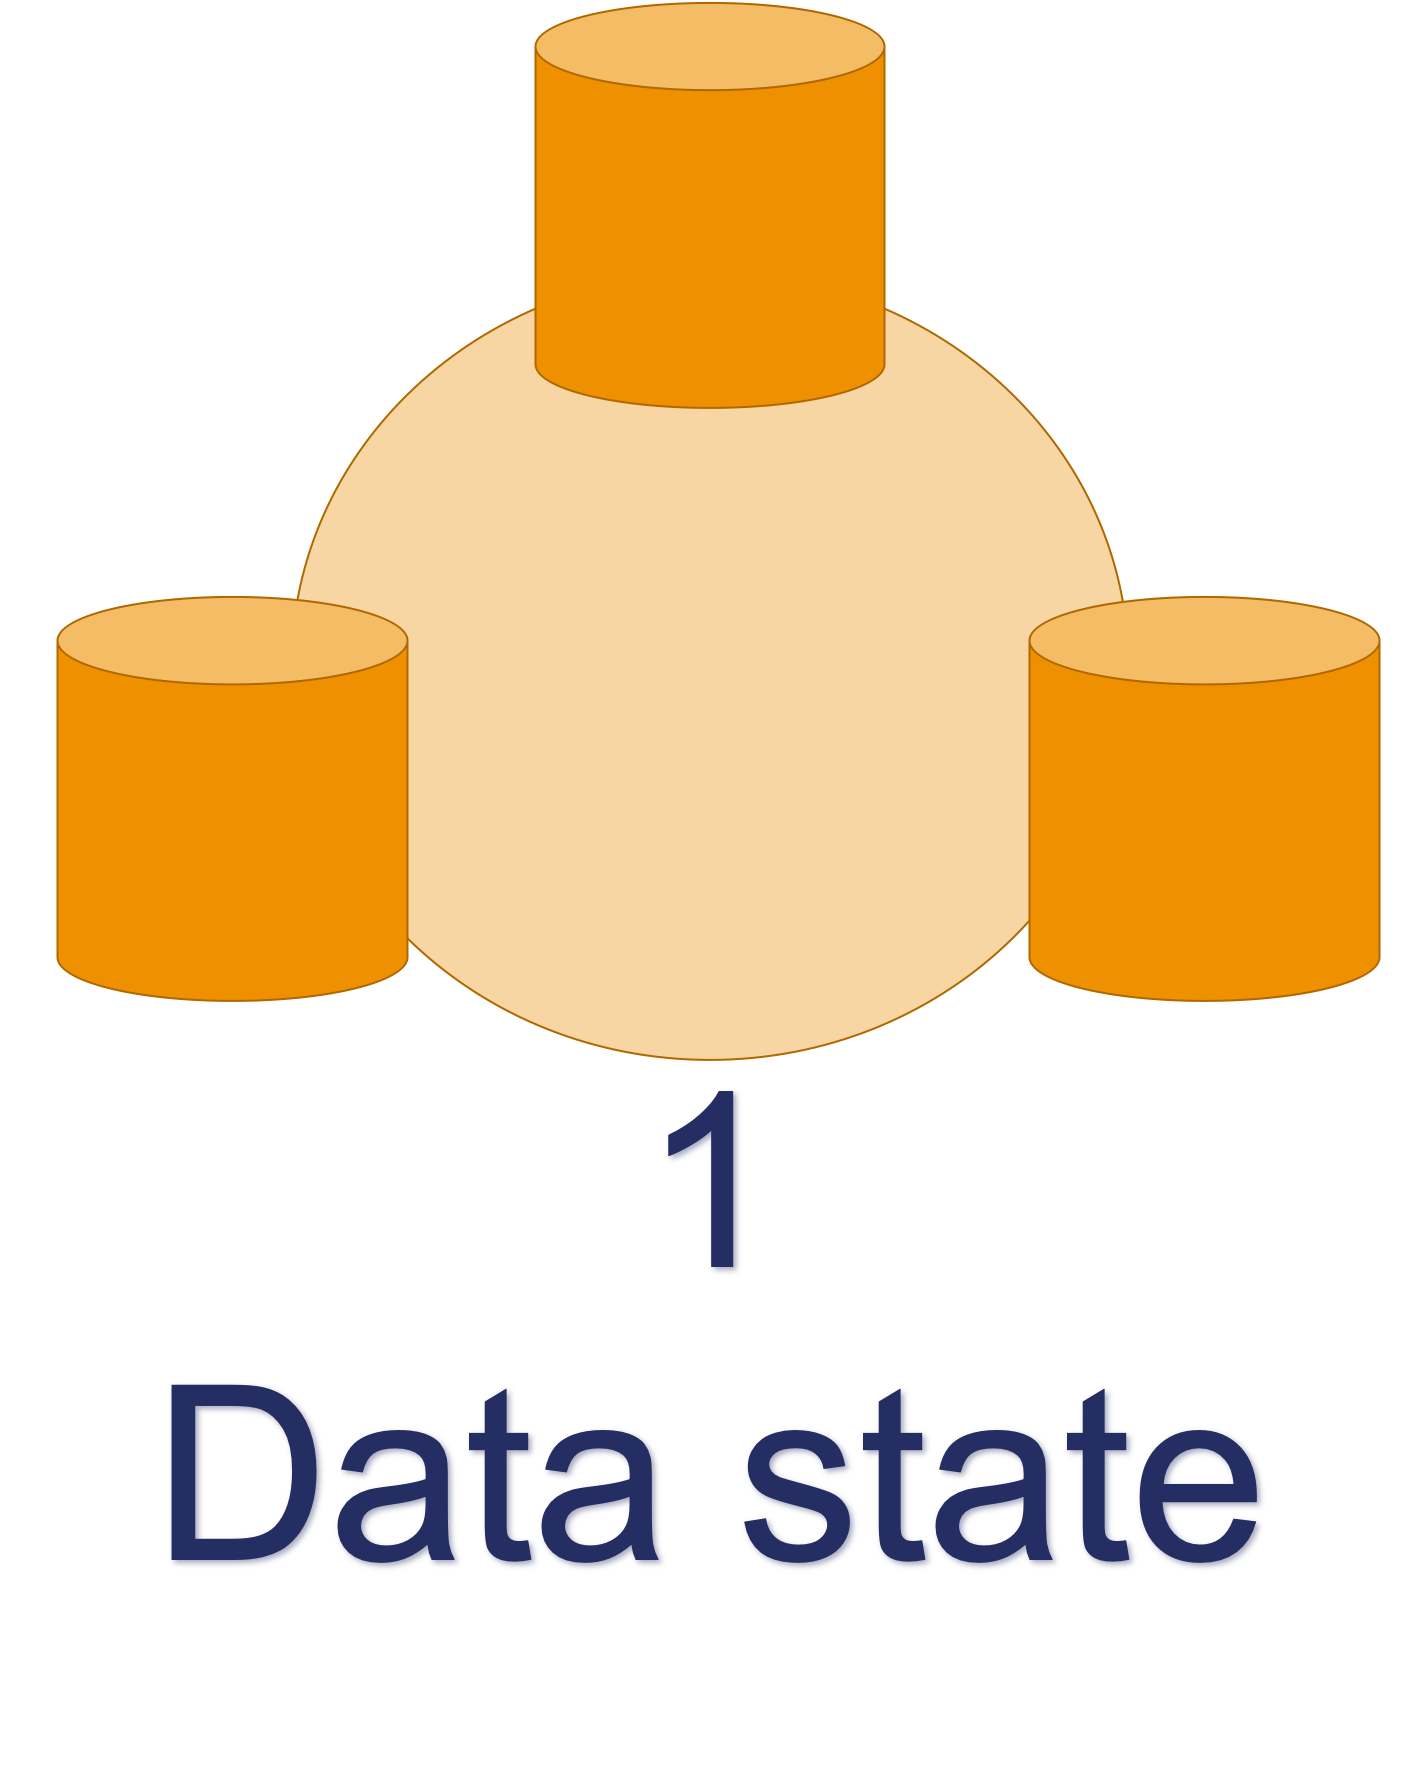
Where all the data nodes see a single state of the data. This is it, you will consistently see the same data at a given T moment in time, where T is the moment of commit on the writer.
Or we have data distributed:
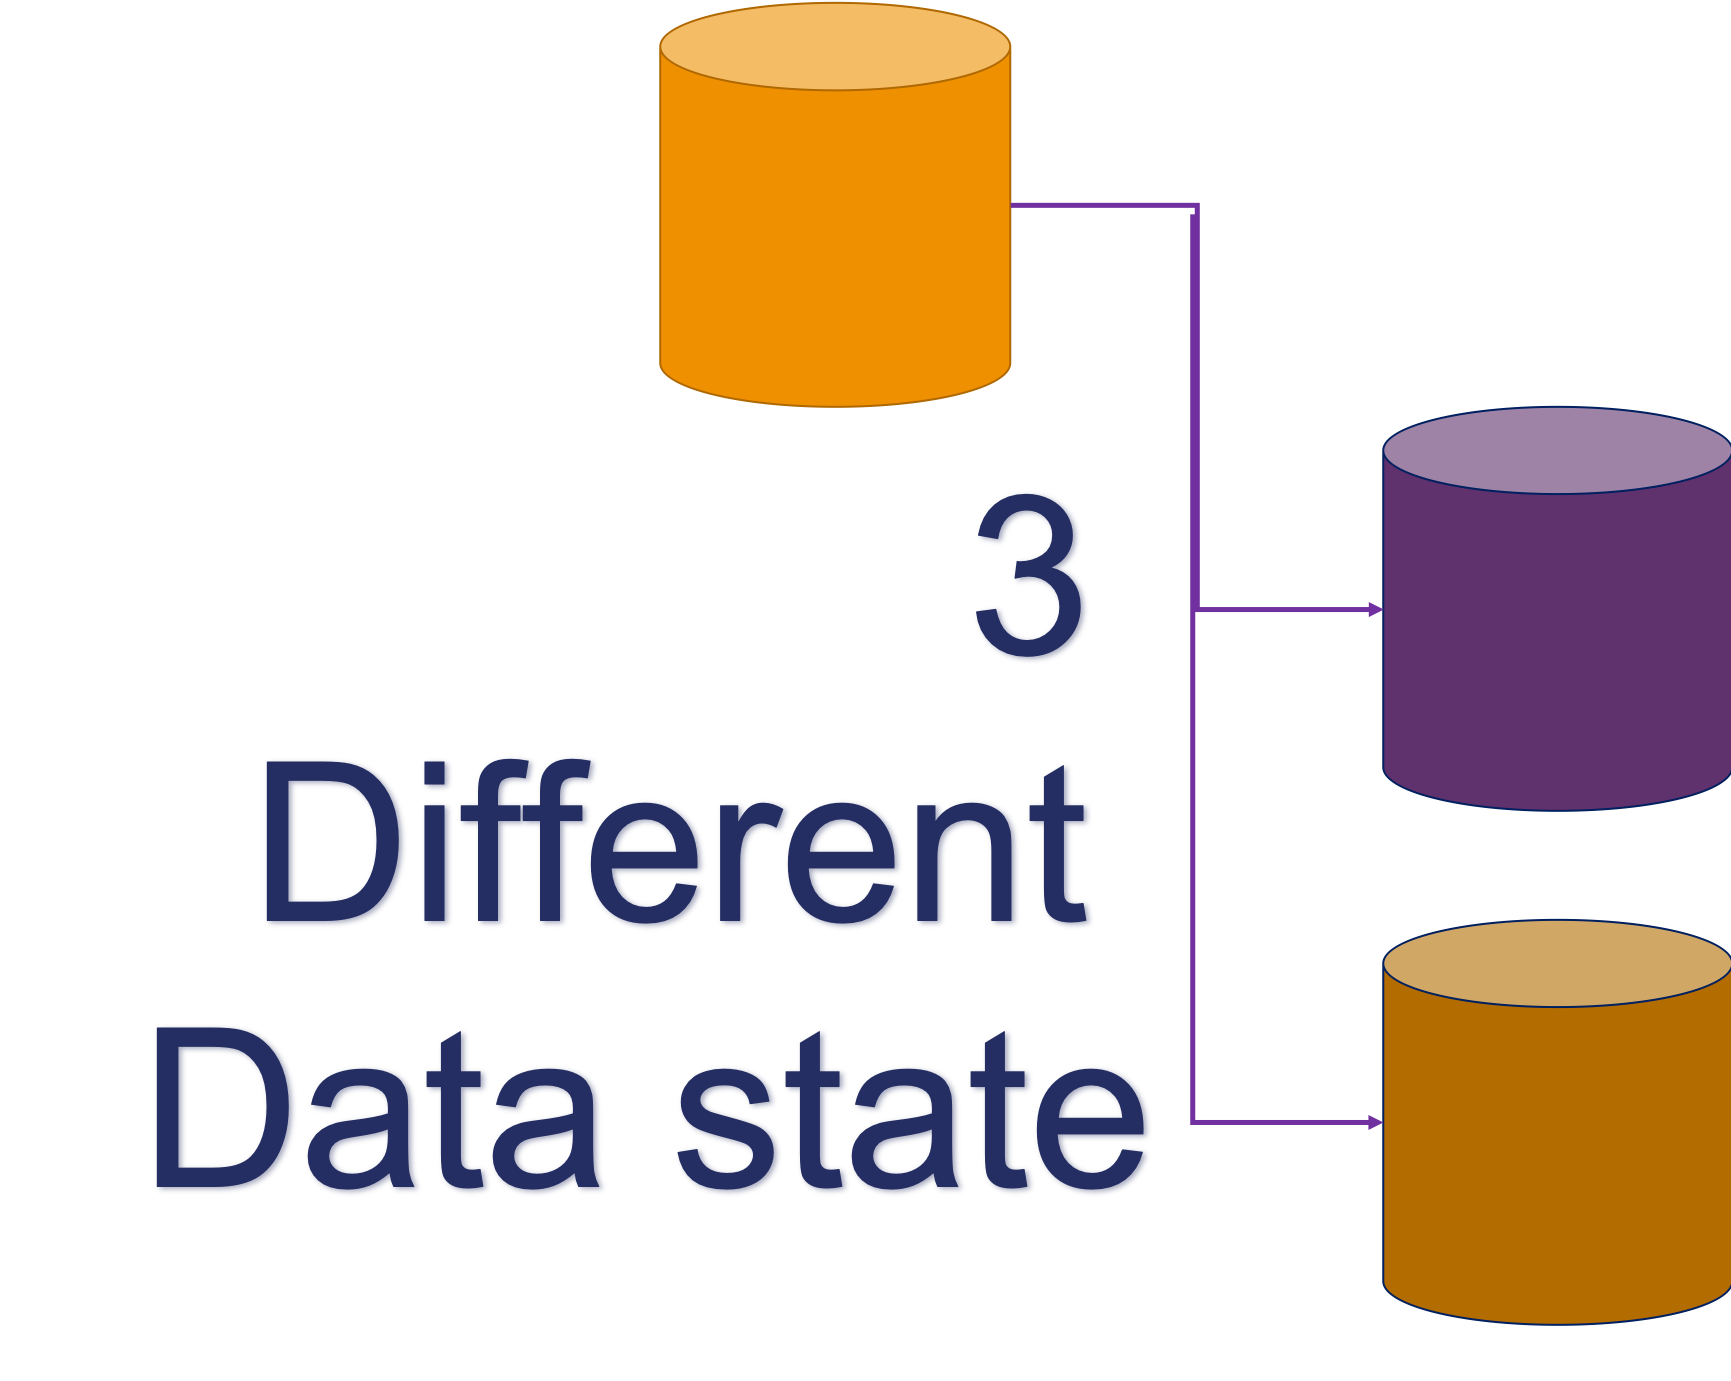
Where each node has an independent data state. This means that data can be visible on the writer, but not yet visible on another node at the moment of commit, and that there is no guarantee that data will be passed over in a given time.
The two extremes can be summarized as follow:
|
Tightly coupled database clusters
|
Loosely coupled database clusters
|
Two ways of seeing the world (the reality)
Given life is not perfect and we do not have only extremes, the most commonly used MySQL solution find their place covering different points in the two-dimensional Cartesian coordinate system:
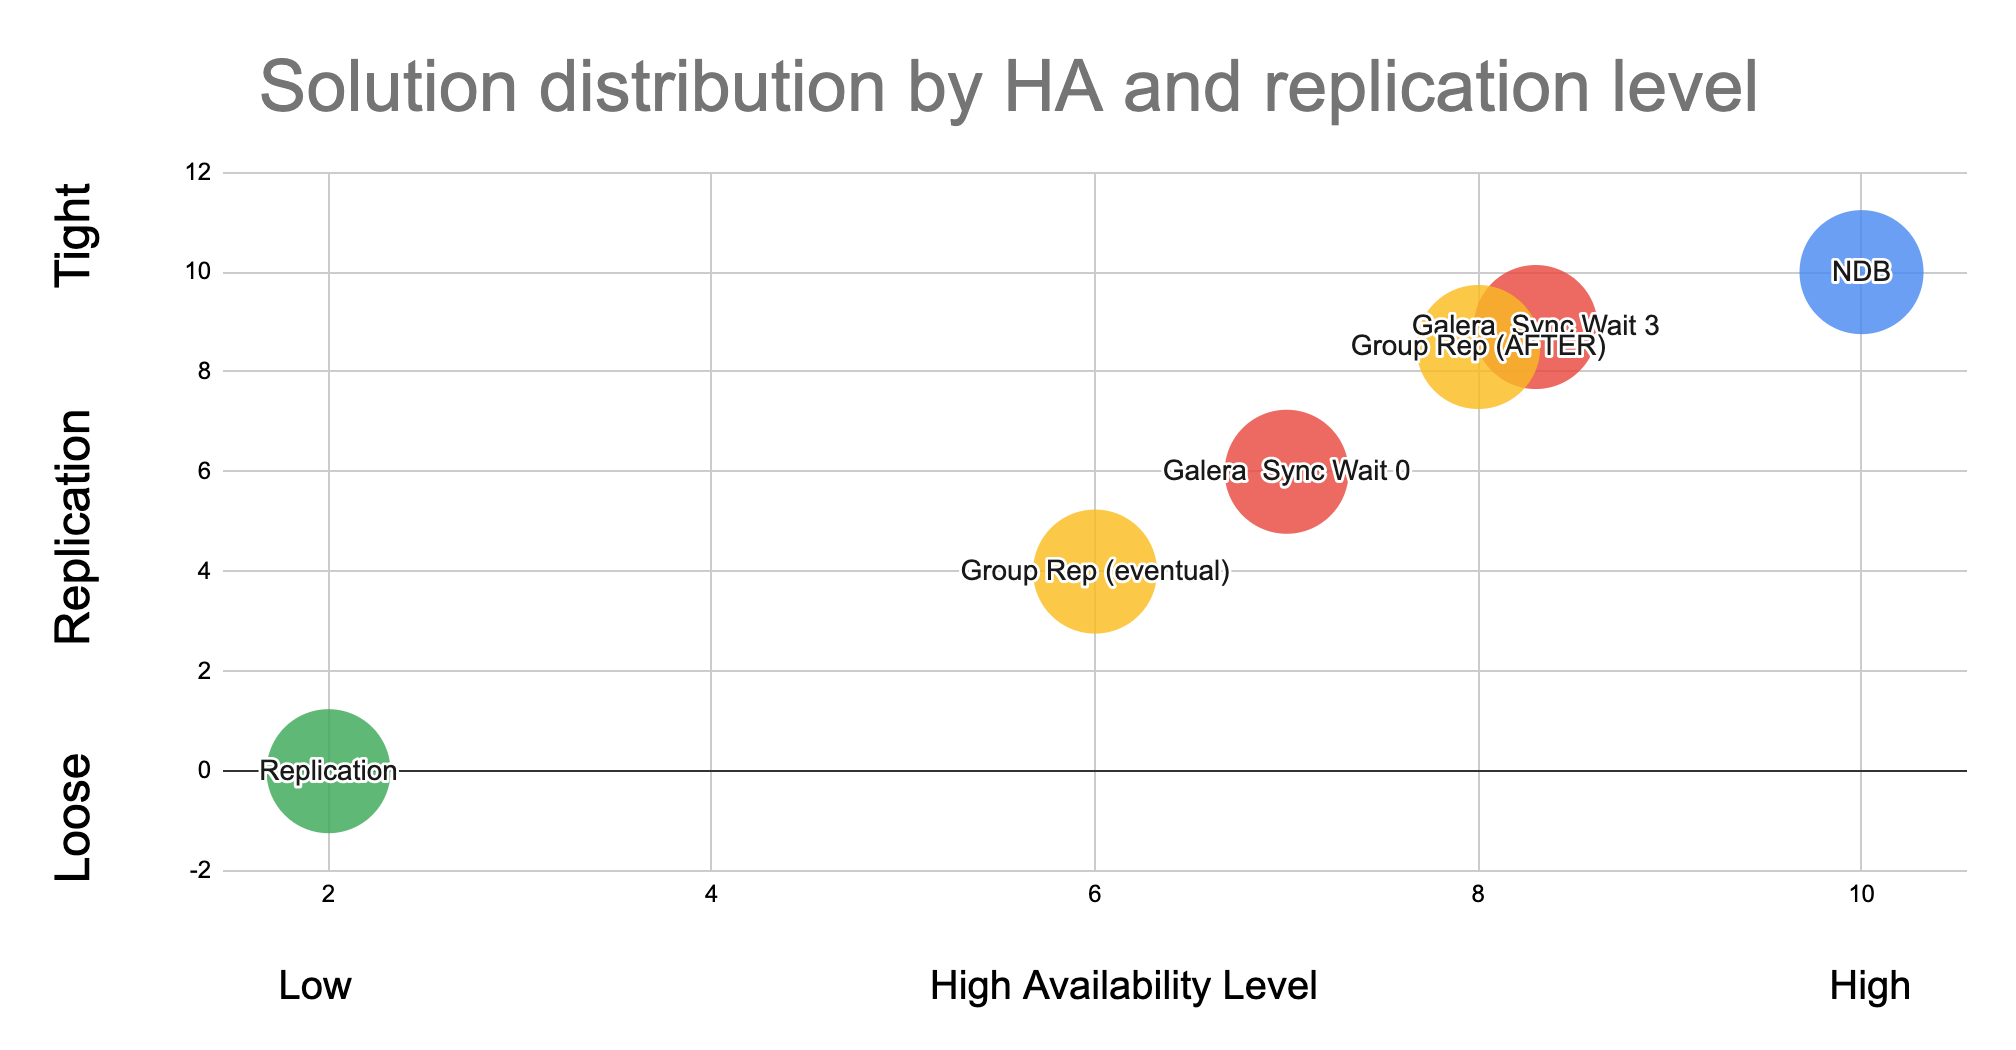
This graph has the level of high availability on the X axis and the level of Loose – Tight relation on the Y axis.
As said I am only considering the most used solutions:
- MySQL – NDB cluster
- Solutions based on Galera
- MySQL Group replication / InnoDB Cluster
- Basic Asynchronous MySQL replication
InnoDB Cluster and Galera are present in two different positions, while the others take a unique position in the graph. At the two extreme position we have Standard replication, which is the one less tight and less HA, and NDB Cluster who is the tightest solution and higher HA.
Translating this into our initial problem, it means that when using NDB we NEVER have Dirty Reads, while when we use standard replication we know this will happen.
Another aspect we must take in consideration when reviewing our solutions, is that nothing come easy. So, the more we want to move to the Right-Top corner the more we need to be ready to give. This can be anything, like performance, functionalities, easy to manage, etc.
When I spoke about the above the first time, I got a few comments, the most common was related on why I decided to position them in that way and HOW I did test it.
Well initially I had a very complex approach, but thanks to the issue with the Dirty Reads and the initial work done by my colleague Marcelo Altman, I can provide a simple empiric way that you can replicate just use the code and instructions from HERE.
Down into the rabbit hole
The platform
To perform the following tests, I have used:
- A ProxySQL server
- An NDB cluster of 3 MySQL nodes 6 data nodes (3 Node Groups)
- A cluster of 3 PXC 5.7 single writer
- An InnoDB cluster 3 nodes single writer
- A 3 nodes MySQL replica set
- 1 Application node running a simple Perl script
All nodes where connected with dedicated backbone network, different from front end receiving data from the script.
The tests
I have run the same simple test script with the same set of rules in ProxySQL.
For Galera and InnoDB cluster I had used the native support in ProxySQL, also because I was trying to emulate the issues I was asked to investigate.
For Standard replication and NDB I had used the mysql_replication_hostgroup settings, with the difference that the later one had 3 Writers, while basic replication has 1 only.
Finally, the script was a single threaded operation, creating a table in the Test schema, filling it with some data, then read the Ids in ascending order, modify the record with update, and try to read immediately after.
When doing that with ProxySQL, the write will go to the writer Host Group (in our case 1 node also for NDB, also if this is suboptimal), while reads are distributed cross the READ Host Group. If for any reason an UPDATE operation is NOT committed on one of the nodes being part of the Reader HG, we will have a dirty read.
Simple no?!
The results
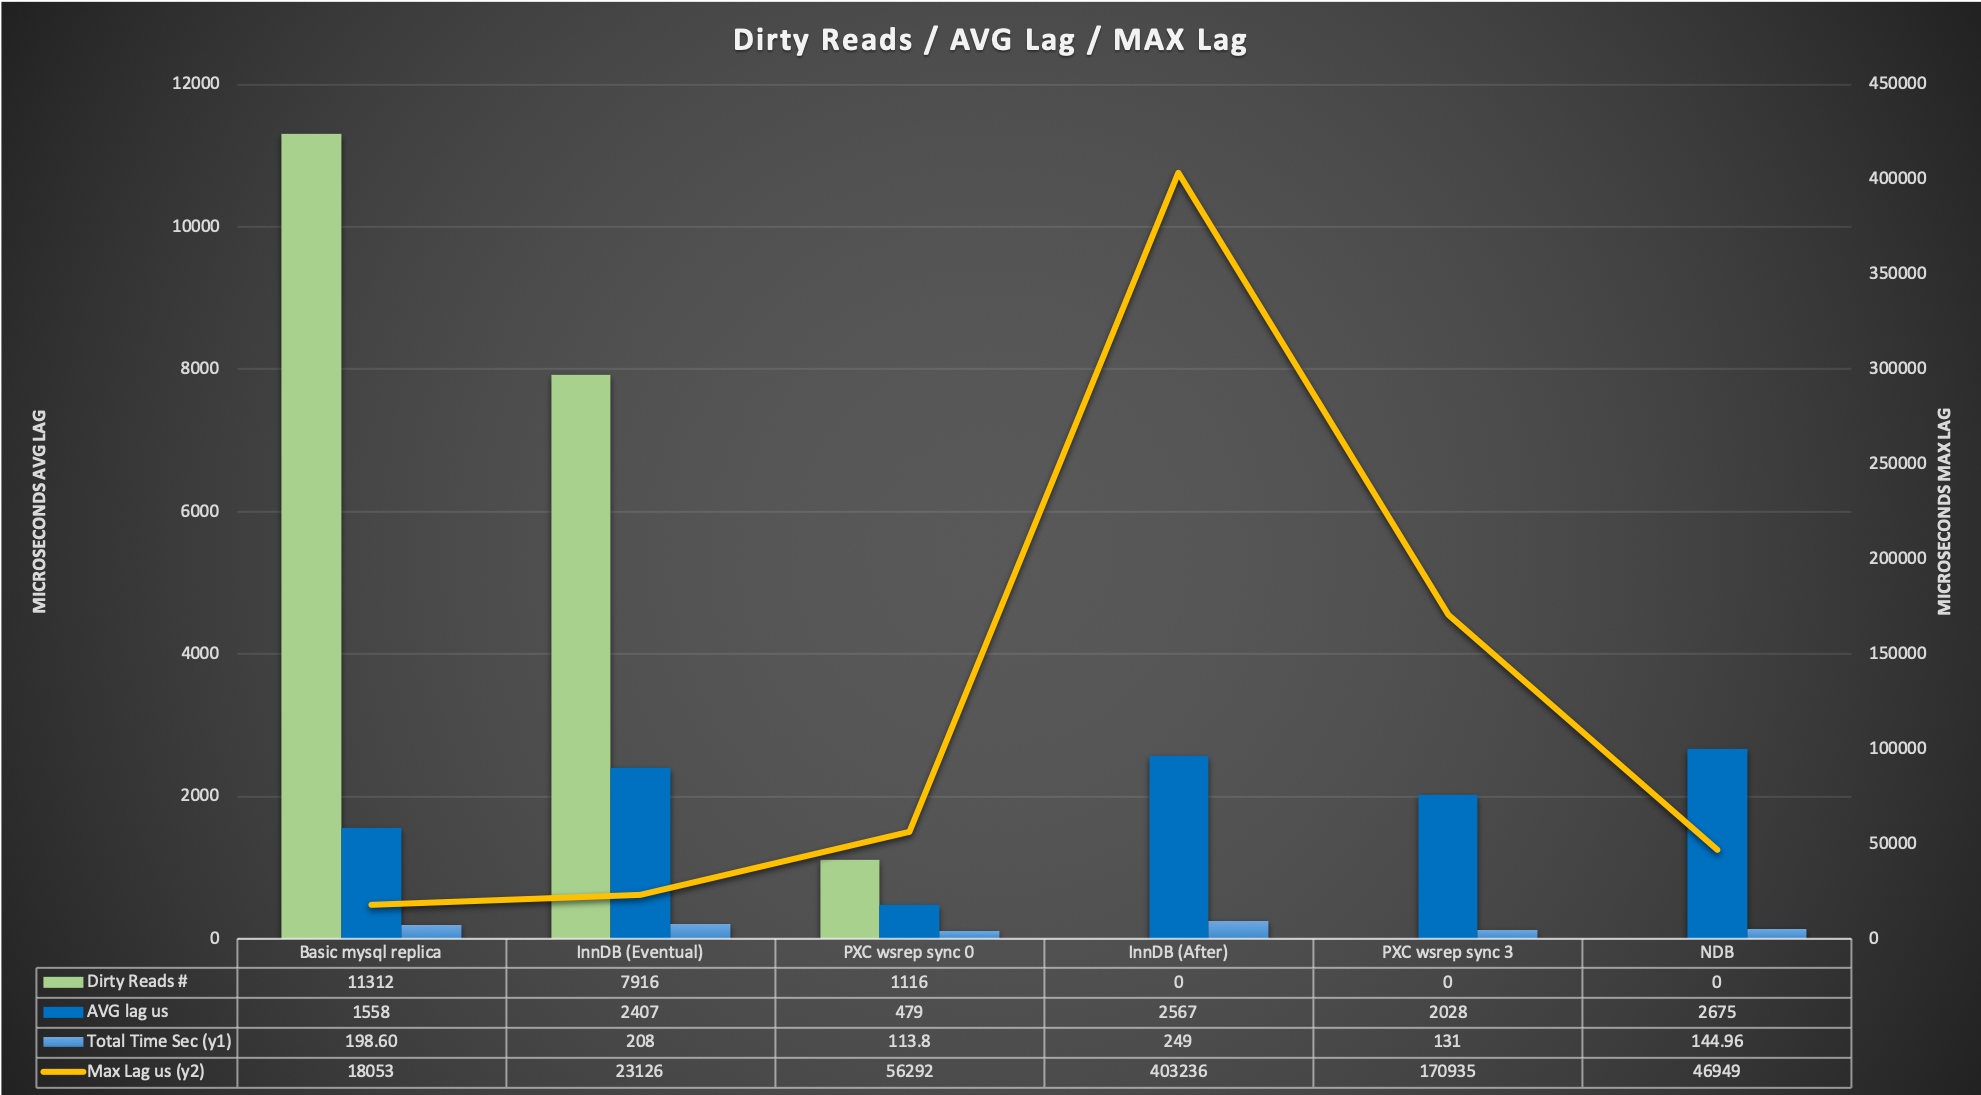
Let us review the graph. Number of dirty reads significantly reduce moving from left to the right of the graph, dropping from 70% of the total with basic replication to the 0.06% with Galera (sync_wait =0).
The average lag is the average time taken from the update commit to when the script returns the read with the correct data.
It is interesting to note a few factors:
- The average cost time in GR between EVENTUAL and AFTER is negligible
- Galera average cost between sync_wait=0 and sync_wait=3 is 4 times longer
- NDB is getting an average cost that is in line with the other BUT its max Lag is very low, so the fluctuation because the synchronization is minimal (respect to the others)
- GR and Galera can have 0 dirty reads but they need to be configured correctly.
Describing a bit more the scenario, MySQL NDB cluster is the best, period! Less performant in single thread than PXC but this is expected, given NDB is designed to have a HIGH number of simultaneous transactions with very limited impact. Aside that it has 0 dirty pages no appreciable lag between writer commit – reader.
On the other side of the spectrum we have MySQL replication with the highest number of dirty reads, still performance was not bad but data is totally inconsistent.
Galera (PXC implementation) is the faster solution when single threaded and has only 0.06% of dirty reads with WSREP_SYNC_WAIT=0, and 0 dirty pages when SYNC_WAIT=3.
About galera we are seen and paying something that is like that by design. A very good presentation (https://www.slideshare.net/lefred.descamps/galera-replication-demystified-how-does-it-work) from Fred Descamps explain how the whole thing works.
This slide is a good example:
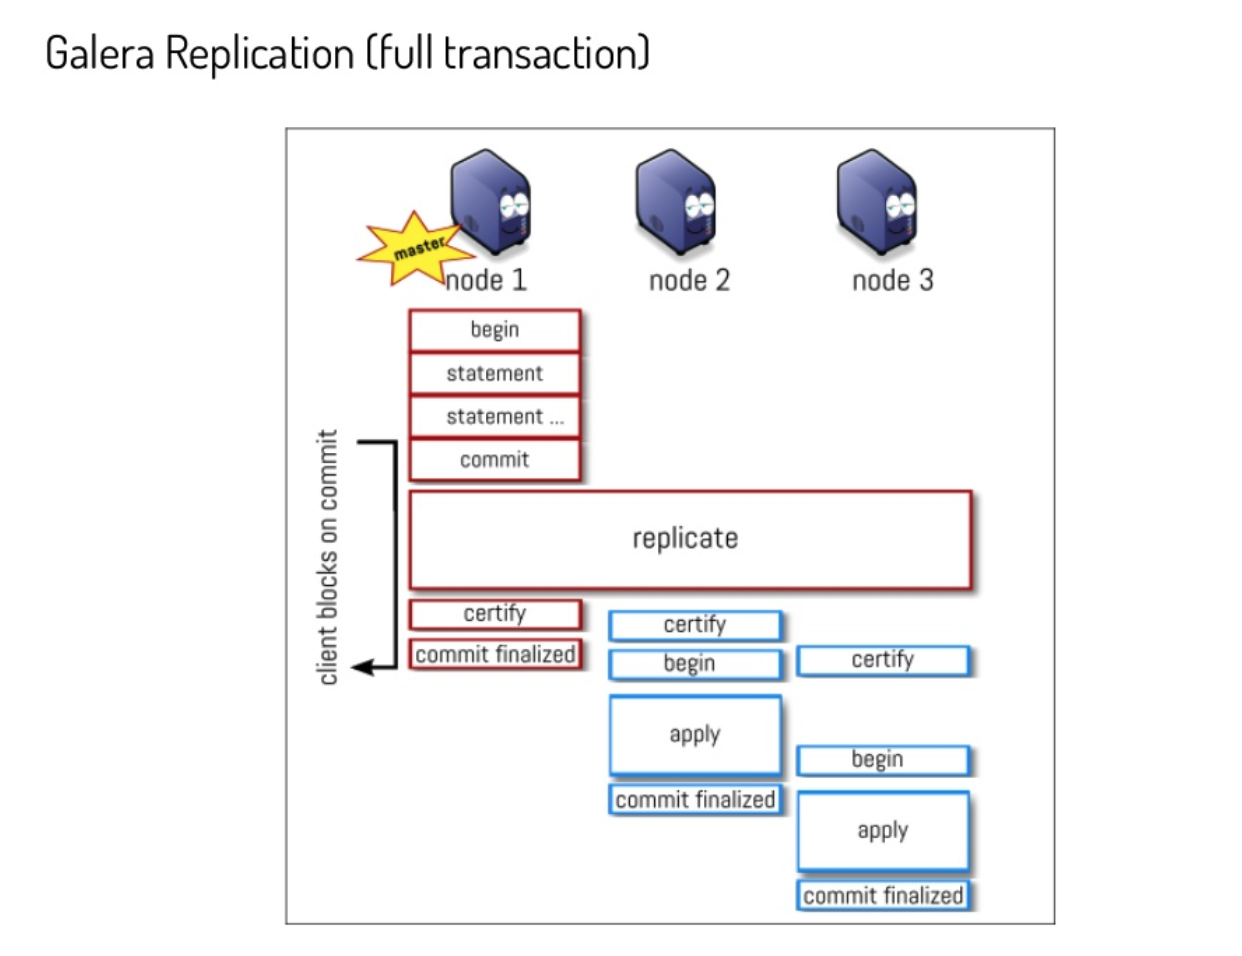
By design the apply and commit finalize in Galera may have (and has) a delay between nodes. When changing the parameter wsrep_sync_wait as explained in the documentation the node initiates a causality check, blocking incoming queries while it catches up with the cluster.
Once all data on the node receiving the READ request is commit_finalized, the node perform the read.
MySQL InnoDB Cluster is worth a bit of discussion. From MySQL 8.0.14 Oracle introduced the parameter group_replication_consistency please read (https://dev.mysql.com/doc/refman/8.0/en/group-replication-consistency-guarantees.html), in short MySQL Group replication can now handle in different way the behavior in respect of Write transactions and read consistency.
Relevant to us are two settings:
- EVENTUAL
- Both RO and RW transactions do not wait for preceding transactions to be applied before executing. This was the behavior of Group Replication before the group_replication_consistency variable was added. A RW transaction does not wait for other members to apply a transaction. This means that a transaction could be externalized on one member before the others.
- AFTER
- A RW transaction waits until its changes have been applied to all of the other members. This value has no effect on RO transactions. This mode ensures that when a transaction is committed on the local member, any subsequent transaction reads the written value or a more recent value on any group member. Use this mode with a group that is used for predominantly RO operations to ensure that applied RW transactions are applied everywhere once they commit. This could be used by your application to ensure that subsequent reads fetch the latest data which includes the latest writes.
As shown above using AFTER is a win and will guarantee us to prevent dirty reads with a small cost.
ProxySQL
ProxySQL has native support for Galera and Group replication, including the identification of the transactions/writeset behind. Given that we can think ProxySQL SHOULD prevent dirty reads, and it actually does when the entity is such to be caught.
But dirty reads can happen in such so small-time window that ProxySQL cannot catch them.
As indicated above we are talking of microseconds or 1-2 milliseconds. To catch such small entity ProxySQL monitor should pollute the MySQL servers with requests, and still possibly miss them given network latency.
Given the above, the dirty read factor, should be handled internally as MySQL Group Replication and Galera are doing, providing the flexibility to choose what to do.
There are always exceptions, and in our case the exception is in the case of basic MySQL replication. In that case, you can install and use the ProxySQL binlog reader, that could help to keep the READS under control, but will NOT be able to prevent them when happening a very small time and number.
Conclusion
Nothing comes for free, dirty reads is one of “those” things that can be prevented but we must be ready to give something back.
It doesn’t matter what, but we cannot get all at the same time.
Given that is important to identify case by case WHICH solution fits better, sometimes it can be NDB, others Galera or Group replication. There is NOT a silver bullet and there is not a single way to proceed.
Also, when using Galera or GR the more demanding setting to prevent dirty reads, can be set at the SESSION level, reducing the global cost.
Summarizing
- NDB is the best, but is complex and fits only some specific usage like high number of threads; simple schema definition; in memory dataset
- Galera is great and it helps in joining performance and efficiency. It is a fast solution but can be flexible enough to prevent dirty reads with some cost.
Use WSREP_SYNC_WAIT to tune that see (https://galeracluster.com/library/documentation/mysql-wsrep-options.html#wsrep-sync-wait) - MySQL Group Replication come actually attached, we can avoid dirty reads, it cost a bit use SET group_replication_consistency= 'AFTER' for that.
- Standard replication can use ProxySQL Binlog Reader, it will help but will not prevent the dirty reads.
To be clear:
- With Galera use WSREP_SYNC_WAIT=3 for reads consistency
- With GR use group_replication_consistency= 'AFTER'
I suggest to use SESSION not GLOBAL and play a bit with the settings to understand well what is going on.
I hope this article had given you a better understanding of what solutions we have out there, such that you will be able to perform an informed decision when in need.
Reference
https://www.proxysql.com/blog/proxysql-gtid-causal-reads
https://github.com/Tusamarco/proxy_sql_tools/tree/master/proxy_debug_tools
https://en.wikipedia.org/wiki/Isolation_(database_systems)#Dirty_reads
https://galeracluster.com/library/documentation/mysql-wsrep-options.html#wsrep-sync-wait
https://dev.mysql.com/doc/refman/8.0/en/group-replication-configuring-consistency-guarantees.html
https://www.slideshare.net/lefred.descamps/galera-replication-demystified-how-does-it-work