====================================================================================================
MySQL Cluster and SUN T2000
====================================================================================================
Why this short How To
====================================================================================================
Recently I found myself in trouble at client site.
Why? I was suppose to validate an installation of MySQL Cluster at the client, skipping that in any
case the architecture put in place by the client was very, very, very far to be acceptable for a
cluster solution, I found myself in trouble because the cluster was not delivering the expected
numbers.
So far nothing bad, that was probably due by bad configuration. So I started to review the configuration
trying to identify which one is the appropriate for that kind of machine architecture.
Here I found the first knowledge gap. Ok no public documents about the kind of performance we could
expect from a MySQL running on T2000, but I didn't found also internal documentation. More not clear
indication on how the different cluster modules runs on T2000 too.
Finally ( I am lucky.. I can access information directly from the source), so let me ask to the engineers
about cluster, and to SUN HW specialist about CMT and T2000, they will have clear answers for sure...
Guess what ... nothing really interesting comes up, nothing really organically explained come up.
Only some generic statements like try this, try that, which generate more confusion to me and to the client.
Who was correctly looking a this as a serious lack of knowledge.
Also from HW side the only comments I got was that T2000 are not recommended for Database usage, and
the client should move to a different HW like M3000.
My nature is to understand, and have a clear understanding of what is really going on, not accepting
to remain in the doubt. At the end these are just bits, we should NOT count on faith when talking
about computer.
So I decide to stop the consultancy because doing the exercise in that way was leading us no where.
I ask to a colleague of mine (which is "the" cluster expert) support in doing some tests, and we ask
to have access to our internal lab on two T2000 machines, in order to replicate the exercise/architecture
at client site.
He give me some initial hint which helps me a lot to identify the correct way to go through.
/*******************************************************************
====================================================================
D I S C L A I M E R
====================================================================
/*******************************************************************
The following description is the report of this exercises, and the outcome, with my personal interpretation,
I am *NOT* expressing the official MySQL or SUN opinion about cluster and how it works.
The following are *only* mine considerations and ideas, correct or wrong I am not expressing in any
way a company opinion.
So if you will find something wrong just fix it and let me know, do not blame anyone.
====================================================================
/*******************************************************************
====================================================================================================
Few Notes about cluster
====================================================================================================
Cluster is a quite complex product and (luckily) it is a quite live product with a lot of development
on going.
Good thing is that we are evolving, bad thing is that sometime it is difficult to keep track of all
the changes and related affected modules.
I assume that you have already a good knowledge about cluster, so I am *not* going to explain in details
how to set up a "vanilla" cluster version, but only how to setup it on T2000 and *my* understanding
of they "why" I had to do that.
Single thread vs multi-thread
----------------------------------------------------------------------------------------------------
Starting from version 7.x we have the possibility to run the cluster in multi thread mode, this is not automatically done, and require few actions.
First remember that the standard demon is not multi-thread (ndbd), in order to execute the multi-thread
you must use the ndbmtd demon, not only you *must* set the multi thread parameter on the "config.ini"
in the ndbd_default section:
### Multi-threading
MaxNoOfExecutionThreads=8
Indicating the maximum number of the desired threads (max 8).
This will push the ndbmtd demon to use multi-thread. The suggested settings are:
Number of Cores Recommended MaxNoOfExecutionThreads Value
2 2
4 4
8 or more 8
Following the documentation the ndbmtd in any case open 4 threads:
* 1 local query handler (LQH) thread
* 1 transaction coordinator (TC) thread
* 1 transporter thread
* 1 subscription manager (SUMA) thread
Setting this parameter to a value between 4 and 8 inclusive causes additional LQH threads to be
used by ndbmtd (up to a maximum of 4 LQH threads), as shown in the following table:
config.ini Value Value Used Number of LQH Threads Used
3 2 1
5 or 6 4 2
7 8 4
Hum quite interesting,
Setting this parameter outside the permitted range of values causes the management server to abort
on startup with the error Error line number: Illegal value value for parameter MaxNoOfExecutionThreads.
Last from the manual in case of errors:
"In the event of a critical error, ndbmtd generates trace files describing what happened just prior to the error' occurrence. These files, which can be found in the data node's DataDir, are useful for analysis of problems by the MySQL Cluster Development and Support teams. One trace file is generated for each ndbmtd thread. The names of these files follow the pattern ndb_node_id_trace.log.trace_id_tthread_id, where node_id is the data node's unique node ID in the cluster, trace_id is a trace sequence number, and thread_id is the thread ID. For example, in the event of the failure of an ndbmtd process running as a MySQL Cluster data node having the node ID 3 and with MaxNoOfExecutionThreads equal to 4, four trace files are generated in the data node's data directory; if the is the first time this node has failed, then these files are named ndb_3_trace.log.1_t1, ndb_3_trace.log.1_t2, ndb_3_trace.log.1_t3, and ndb_3_trace.log.1_t4. Internally, these trace files follow the same format as ndbd trace files. "
So far so good!!
----------------------------------------------------------------------------------------------------
Now before going ahead let us take some few minutes to understand a little bit better, a very
important thing just mentioned above, that if you don't know it will simply be ignored.
Try to search in the manual section for LQH, You will get two links:
dev.mysql.com/doc/refman/5.1/en/mysql-cluster-ndbmtd-process.html
dev.mysql.com/doc/refman/5.1/en/mysql-cluster-log-statistics.html
None of the is the one that will give you the information I was looking for, but while we are here just waste 2 minutes on the second one.
Using CLUSTERLOG STATISTICS in the MySQL Cluster Management Client
----------------------------------------------------------------------------------------------------
Logging is the secret to understand what is going on inside any software, so let us go through this section a little bit.
First of all we have to enable the logging in the cluster, don't waste your time ask to print all:
from inside the ndb_mgm > all clusterlog statistics=15
from now all will printed out.
"Counters providing information about the state of the cluster are updated at 5-second reporting intervals by the transaction coordinator (TC) and the local query handler (LQH), and written to the cluster log."
Main actors are the Transaction Coordinators and the Local Query Handler (please to the manual page for full reference on what is good and what is bad).
But at the bottom of the page there is an interesting section:
"Process scheduler statistics. In addition to the statistics reported by the transaction coordinator and local query handler, each ndbd process has a scheduler which also provides useful metrics relating to the performance of a MySQL Cluster. This scheduler runs in an infinite loop; during each loop the scheduler performs the following tasks:
1. Read any incoming messages from sockets into a job buffer.
2. Check whether there are any timed messages to be executed; if so, put these into the job buffer as well.
3. Execute (in a loop) any messages in the job buffer.
4. Send any distributed messages that were generated by executing the messages in the job buffer.
5. Wait for any new incoming messages.
Process scheduler statistics include the following:
* Mean Loop Counter. This is the number of loops executed in the third step from the preceding list. This statistic increases in size as the utilization of the TCP/IP buffer improves. You can use this to monitor changes in performance as you add new data node processes.
* Mean send size and Mean receive size. These statistics allow you to gauge the efficiency of, respectively writes and reads between nodes. The values are given in bytes. Higher values mean a lower cost per byte sent or received; the maximum value is 64K.
"
Humm keep this in mind for future use/reference.
Ok ready? we know what we should look for now in the cluster log, good let us go back to the search.
Searching is not an easy task it is ART!!
====================================================================================================
Well true...
by the way, change the drop down from Manual reference to Developer zone, and submit the request for LQH once more...
Ooooh what a surprise we got 79 entries!!! And the first one is exactly what we need to understand a little bit better what and how, is our cluster doing while running.
So let us go there and see what we have, click on http://dev.mysql.com/doc/ndbapi/en/ndb-internals-kernel-blocks.html, we will got the following list of cluster kernel modules:
5.4.1. The BACKUP Block
5.4.2. The CMVMI Block
5.4.3. The DBACC Block
5.4.4. The DBDICT Block
5.4.5. The DBDIH Block
5.4.6. DBLQH Block
5.4.7. The DBTC Block
5.4.8. The DBTUP Block
5.4.9. DBTUX Block
5.4.10. The DBUTIL Block
5.4.11. The LGMAN Block
5.4.12. The NDBCNTR Block
5.4.13. The NDBFS Block
5.4.14. The PGMAN Block
5.4.15. The QMGR Block
5.4.16. The RESTORE Block
5.4.17. The SUMA Block
5.4.18. The TSMAN Block
5.4.19. The TRIX Block
Well if it was not clear up to know, there is a lot more in cluster to look for then what you are use to!
Briefly
----------------------------------------------------------------------------------------------------
BACKUP:
This block is responsible for handling online backups and checkpoints.
DBACC:
Also referred to as the ACC block, this is the access control and lock management module.
DBDICT:
This block, the data dictionary block, is found in storage/ndb/src/kernel/blocks/dbdict. Data dictionary information is replicated to all DICT blocks in the cluster. This is the only block other than DBTC to which applications can send direct requests. DBDICT is responsible for managing metadata (via the cluster's master node) such as table and index definitions, as well as many Disk Data operations.
DBDIH:
This block provides data distribution (partitioning) management services. It is responsible for maintaining data fragments and replicas, handling of local and global checkpoints; it also manages node and system restarts.
DBTUP:
This is the tuple manager, which manages the physical storage of cluster data.
DBTUX:
This kernel block handles the local management of ordered indexes.
DBUTIL:
This block provides internal interfaces to transaction and data operations, performing essential operations on signals passed between nodes. This block implements transactional services which can then be used by other blocks. It is also used in building online indexes.
LGMAN:
This block, the log group manager, is responsible for handling the undo logs for Disk Data tables.
NDBCNTR:
This is a cluster management block that handles block initialisation and configuration. During the data node startup process, it takes over from the QMGR block and continues the process. It also assist with graceful (planned) shutdowns of data nodes.
NDBFS:
This block provides the NDB file system abstraction layer.
PGMAN:
This block provides page and buffer management services for Disk Data tables.
QMGR:
This is the logical cluster management block, and handles node membership in the cluster via heartbeats. QMGR is responsible for polling the data nodes when a data node failure occurs and determining that the node has actually failed and should be dropped from the cluster.
RESTORE:
This block consists of the files restore.cpp and restore.hpp, in the storage/ndb/src/kernel/blocks directory. It handles restoration of the cluster from online backups.
SUMA:
The cluster subscription manager, which handles event logging and reporting, functions. It also figures prominently in MySQL Cluster Replication.
TSMAN:
This is the tablespace manager block for Disk Data tables, and includes the following files from storage/ndb.
TRIX:
This kernel block is responsible for the handling of internal triggers and unique indexes. TRIX, like DBUTIL, is a utility block containing many helper functions for building indexes and handling signals between nodes.
-----------
CMVMI:
This block is responsible for configuration management between the kernel blocks and the NDB virtual machine, as well as the cluster job que and cluster transporters.
(NOT IN THE MANUAL BUT I ADD IT)
The thread running the CMVMI block also pulls all data from the node's transporters. This requires a fair amount of data copying, creating linked buffers which are then generally put on the work queues (job buffers) of other threads.
DBLQH:
This is the local, low-level query handler block, which manages data and transactions local to the cluster's data nodes, and acts as a coordinator of 2-phase commits. It is responsible (when called on by the transaction coordinator) for performing operations on tuples, accomplishing this task with help of DBACC block (which manages the index structures) and DBTUP (which manages the tuples).
DBTC:
This is the transaction coordinator block, which handles distributed transactions and other data operations on a global level (as opposed to DBLQH which deals with such issues on individual data nodes).
Why this digression on kernel blocks? You will see quite soon.
For the moment it seems we have enough block to start our adventure on T2000...
====================================================================================================
T2000 adventure
====================================================================================================
The tests were run on a T2000 as describe:
: prtdiag
System Configuration: Sun Microsystems sun4v Sun Fire T200
Memory size: 32640 Megabytes
================================ Virtual CPUs ================================
CPU ID Frequency Implementation Status
------ --------- ---------------------- -------
0 1200 MHz SUNW,UltraSPARC-T1
1 1200 MHz SUNW,UltraSPARC-T1
2 1200 MHz SUNW,UltraSPARC-T1
3 1200 MHz SUNW,UltraSPARC-T1
4 1200 MHz SUNW,UltraSPARC-T1
5 1200 MHz SUNW,UltraSPARC-T1
6 1200 MHz SUNW,UltraSPARC-T1
7 1200 MHz SUNW,UltraSPARC-T1
8 1200 MHz SUNW,UltraSPARC-T1
9 1200 MHz SUNW,UltraSPARC-T1
10 1200 MHz SUNW,UltraSPARC-T1
11 1200 MHz SUNW,UltraSPARC-T1
12 1200 MHz SUNW,UltraSPARC-T1
13 1200 MHz SUNW,UltraSPARC-T1
14 1200 MHz SUNW,UltraSPARC-T1
15 1200 MHz SUNW,UltraSPARC-T1
16 1200 MHz SUNW,UltraSPARC-T1
17 1200 MHz SUNW,UltraSPARC-T1
18 1200 MHz SUNW,UltraSPARC-T1
19 1200 MHz SUNW,UltraSPARC-T1
20 1200 MHz SUNW,UltraSPARC-T1
21 1200 MHz SUNW,UltraSPARC-T1
22 1200 MHz SUNW,UltraSPARC-T1
23 1200 MHz SUNW,UltraSPARC-T1
24 1200 MHz SUNW,UltraSPARC-T1
25 1200 MHz SUNW,UltraSPARC-T1
26 1200 MHz SUNW,UltraSPARC-T1
27 1200 MHz SUNW,UltraSPARC-T1
28 1200 MHz SUNW,UltraSPARC-T1
29 1200 MHz SUNW,UltraSPARC-T1
30 1200 MHz SUNW,UltraSPARC-T1
31 1200 MHz SUNW,UltraSPARC-T1
======================= Physical Memory Configuration ========================
Segment Table:
--------------------------------------------------------------
Base Segment Interleave Bank Contains
Address Size Factor Size Modules
--------------------------------------------------------------
0x0 32 GB 4 4 GB MB/CMP0/CH0/R0/D0
MB/CMP0/CH0/R0/D1
4 GB MB/CMP0/CH0/R1/D0
MB/CMP0/CH0/R1/D1
4 GB MB/CMP0/CH1/R0/D0
MB/CMP0/CH1/R0/D1
4 GB MB/CMP0/CH1/R1/D0
MB/CMP0/CH1/R1/D1
4 GB MB/CMP0/CH2/R0/D0
MB/CMP0/CH2/R0/D1
4 GB MB/CMP0/CH2/R1/D0
MB/CMP0/CH2/R1/D1
4 GB MB/CMP0/CH3/R0/D0
MB/CMP0/CH3/R0/D1
4 GB MB/CMP0/CH3/R1/D0
MB/CMP0/CH3/R1/D1
========================= IO Configuration =========================
IO
Location Type Slot Path Name Model
----------- ----- ---- --------------------------------------------- ------------------------- ---------
IOBD/NET0 PCIE IOBD /pci@780/pci@0/pci@1/network@0 network-pciex8086,105e
IOBD/NET1 PCIE IOBD /pci@780/pci@0/pci@1/network@0,1 network-pciex8086,105e
IOBD/PCIE PCIE IOBD /pci@780/pci@0/pci@9/scsi@0 scsi-pciex1000,56 LSI,1064E
IOBD/NET2 PCIE IOBD /pci@7c0/pci@0/pci@2/network@0 network-pciex8086,105e
IOBD/NET3 PCIE IOBD /pci@7c0/pci@0/pci@2/network@0,1 network-pciex8086,105e
IOBD/PCIX PCIX IOBD /pci@7c0/pci@0/pci@1/pci@0/isa@2 isa
IOBD/PCIX PCIX IOBD /pci@7c0/pci@0/pci@1/pci@0/usb@5 usb-pciclass,0c0310
IOBD/PCIX PCIX IOBD /pci@7c0/pci@0/pci@1/pci@0/usb@6 usb-pciclass,0c0310
IOBD/PCIX PCIX IOBD /pci@7c0/pci@0/pci@1/pci@0/ide@8 ide-pci10b9,5229
====================================================================================================
As you can easily notice the CPU is quite slow and the number of 32 is to be intended as "VIRTUAL" so we know that we will have, given the CMT architecture,
Scope of the tests: To identify the better configuration for performing inserts, record dimension 40 bytes.
Given that we have 2 machines, with 2 data nodes and one MySQL with 4 connections.
Let see what will happen trying to insert 100000 records of 40 bytes each.
Opening the data node log (ndb_x_out.log) we will see what kernel block will be associated to which thread:
Adding 1368Mb to ZONE_LO (1,43775)
NDBMT: num_threads=4
thr: 0 tid: 5 DBTC(0) DBDIH(0) DBDICT(0) NDBCNTR(0) QMGR(0) NDBFS(0) TRIX(0) DBUTIL(0)
thr: 3 tid: 1 CMVMI(0)
thr: 1 tid: 6 BACKUP(0) DBLQH(0) DBACC(0) DBTUP(0) SUMA(0) DBTUX(0) TSMAN(0) LGMAN(0) PGMAN(0) RESTORE(0) DBINFO(0) PGMAN(5)
saving 113150000 at 100569948 (0)
thr: 2 tid: 7 PGMAN(1) DBACC(1) DBLQH(1) DBTUP(1) BACKUP(1) DBTUX(1) RESTORE(1)
2009-11-05 14:24:23 [ndbd] INFO -- Start initiated (mysql-5.1.37 ndb-7.0.8)
saving 113330000 at 100575048 (0)
Ok here we have that:
thread 5 will contains DBTC(0) DBDIH(0) DBDICT(0) NDBCNTR(0) QMGR(0) NDBFS(0) TRIX(0) DBUTIL(0)
thread 1 CMVMI
thread 6 BACKUP(0) DBLQH(0) DBACC(0) DBTUP(0) SUMA(0) DBTUX(0) TSMAN(0) LGMAN(0) PGMAN(0) RESTORE(0) DBINFO(0) PGMAN(5)
thread 7 PGMAN(1) DBACC(1) DBLQH(1) DBTUP(1) BACKUP(1) DBTUX(1) RESTORE(1)
Running the test performing INSERTS the cpu utilization for block will be:
PID USERNAME SIZE RSS STATE PRI NICE TIME CPU PROCESS/LWPID
2858 mt221861 2382M 595M sleep 52 0 0:01:36 1.3% ndbmtd/1
2858 mt221861 2382M 595M sleep 52 0 0:01:12 1.1% ndbmtd/7
2858 mt221861 2382M 595M sleep 53 0 0:01:09 0.8% ndbmtd/5
2858 mt221861 2382M 595M sleep 59 0 0:00:36 0.2% ndbmtd/6
2858 mt221861 2382M 595M sleep 59 0 0:00:02 0.0% ndbmtd/34
2858 mt221861 2382M 595M sleep 59 0 0:00:00 0.0% ndbmtd/24
2858 mt221861 2382M 595M sleep 59 0 0:00:00 0.0% ndbmtd/15
2858 mt221861 2382M 595M sleep 59 0 0:00:00 0.0% ndbmtd/14
2858 mt221861 2382M 595M sleep 59 0 0:00:00 0.0% ndbmtd/13
2858 mt221861 2382M 595M sleep 59 0 0:00:00 0.0% ndbmtd/12
2858 mt221861 2382M 595M sleep 59 0 0:00:00 0.0% ndbmtd/11
2858 mt221861 2382M 595M sleep 59 0 0:00:00 0.0% ndbmtd/10
2858 mt221861 2382M 595M sleep 59 0 0:00:00 0.0% ndbmtd/9
2858 mt221861 2382M 595M sleep 59 0 0:00:00 0.0% ndbmtd/8
2858 mt221861 2382M 595M sleep 59 0 0:00:00 0.0% ndbmtd/4
Main activities will be covered by the CMVMI then by the LQH and so on.
The inserts per seconds are 1408 qps, not too much to be honest.
Now let us see what happen when we do searches 4 thread, looking for 100000 each:
Total: 1 processes, 36 lwps, load averages: 0.46, 0.32, 0.29
PID USERNAME SIZE RSS STATE PRI NICE TIME CPU PROCESS/LWPID
2858 mt221861 2382M 596M sleep 42 0 0:03:33 0.6% ndbmtd/5
2858 mt221861 2382M 596M sleep 22 0 0:04:16 0.5% ndbmtd/1
2858 mt221861 2382M 596M sleep 50 0 0:03:14 0.5% ndbmtd/7
2858 mt221861 2382M 596M sleep 59 0 0:01:23 0.0% ndbmtd/6
2858 mt221861 2382M 596M sleep 59 0 0:00:00 0.0% ndbmtd/15
2858 mt221861 2382M 596M sleep 59 0 0:00:00 0.0% ndbmtd/14
2858 mt221861 2382M 596M sleep 59 0 0:00:00 0.0% ndbmtd/13
2858 mt221861 2382M 596M sleep 59 0 0:00:00 0.0% ndbmtd/12
2858 mt221861 2382M 596M sleep 59 0 0:00:00 0.0% ndbmtd/11
2858 mt221861 2382M 596M sleep 59 0 0:00:00 0.0% ndbmtd/10
2858 mt221861 2382M 596M sleep 59 0 0:00:00 0.0% ndbmtd/9
2858 mt221861 2382M 596M sleep 59 0 0:00:00 0.0% ndbmtd/8
2858 mt221861 2382M 596M sleep 59 0 0:00:01 0.0% ndbmtd/4
2858 mt221861 2382M 596M sleep 59 0 0:00:02 0.0% ndbmtd/3
2858 mt221861 2382M 596M sleep 59 0 0:00:01 0.0% ndbmtd/2
Something has changed.
The Kernel block running the TC asks more resources then before ( it make sense no?).
In any case the CPU utilization it is quite low, so let us see if we can squize something more from this machine.
Let us increase the number of Application threads as first.
=========================================================================
The test results
=========================================================================
Analysing only INSERTS for now.
Ok let see what is going on in the simple way: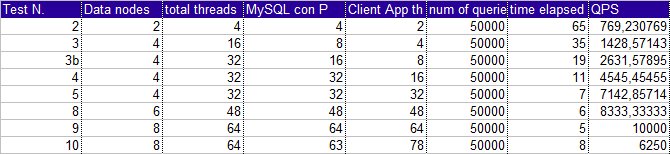
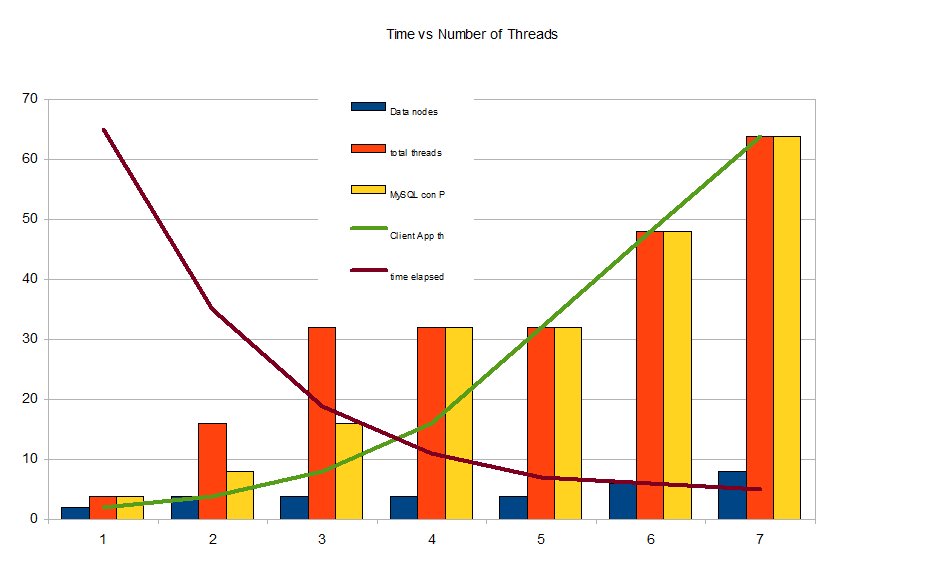
Looking also to the above picture, it quite evident the trend.
Increasing the number of thread client side, MySQL connection pool and data node on the same machines will provide
the required scalability.
Well nothing new, but is really and fully true?
I think no.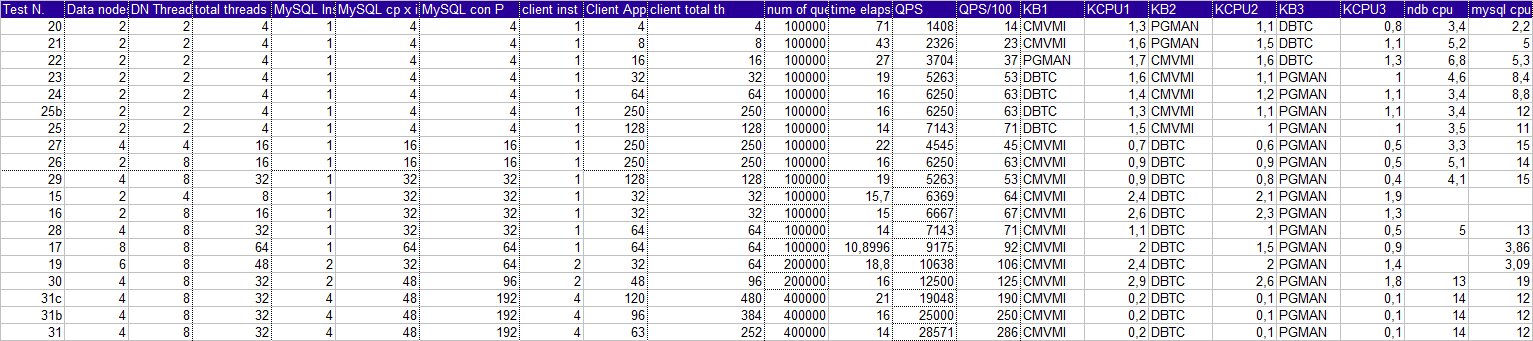
Looking to the following table sorted by QPS, it is possible to identify that the real ramp-up, happen when the number
of Connection pool increase. Not when the number of data node increase, or threads inside a data node.
See also to the picture below
-=Figure 2=-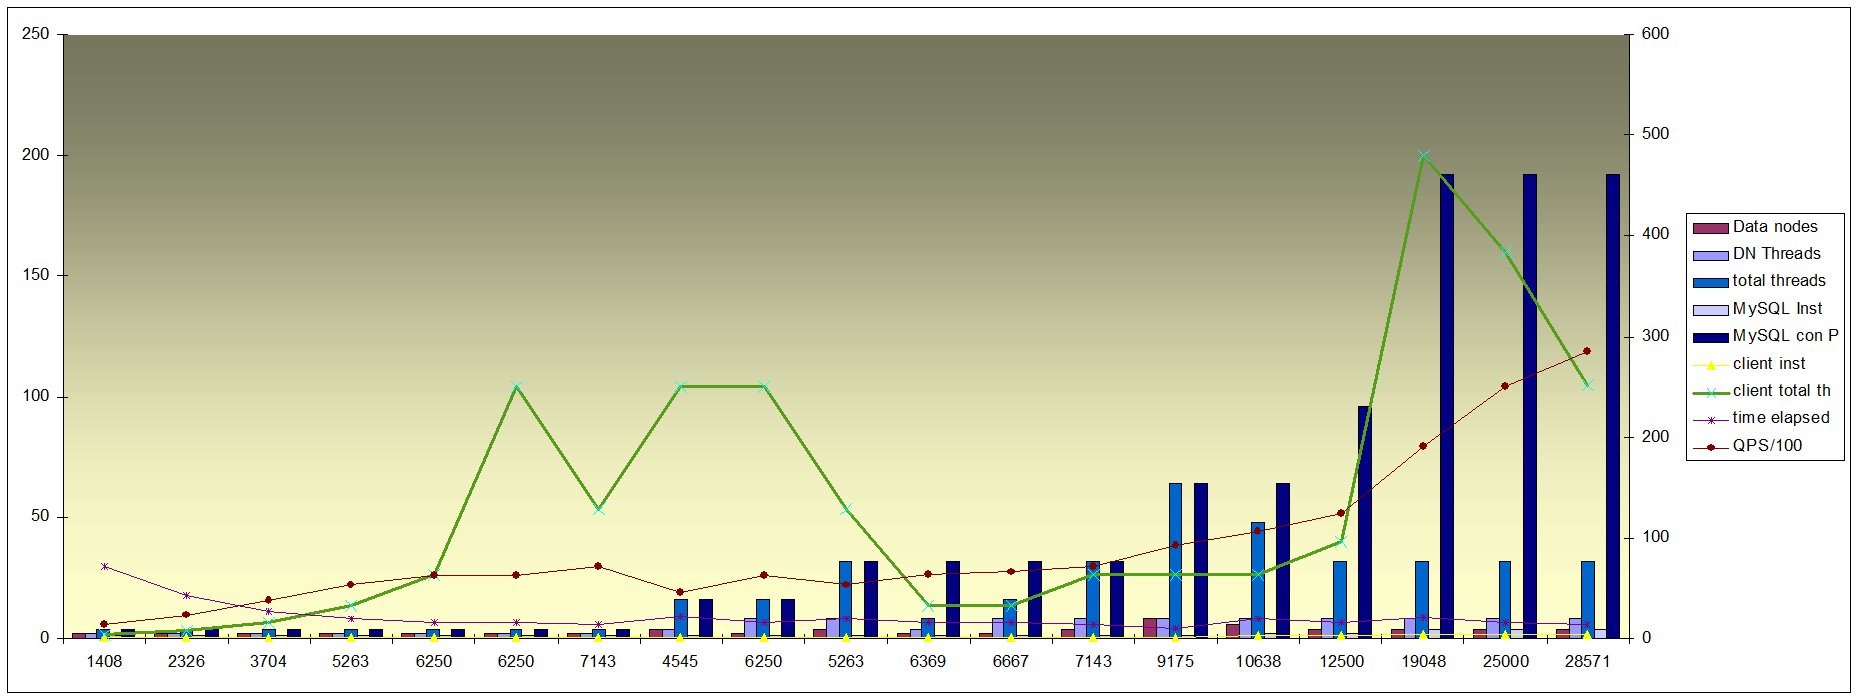
Look at the following table and graph.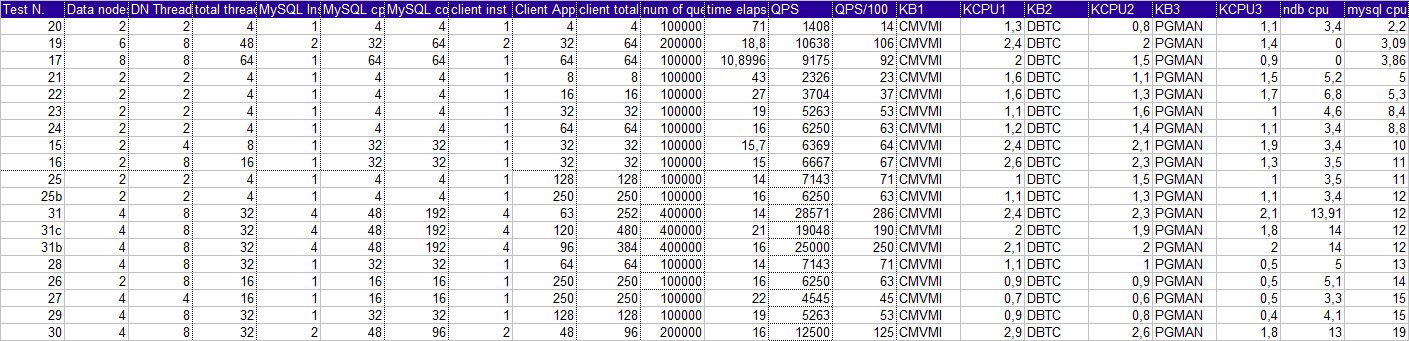
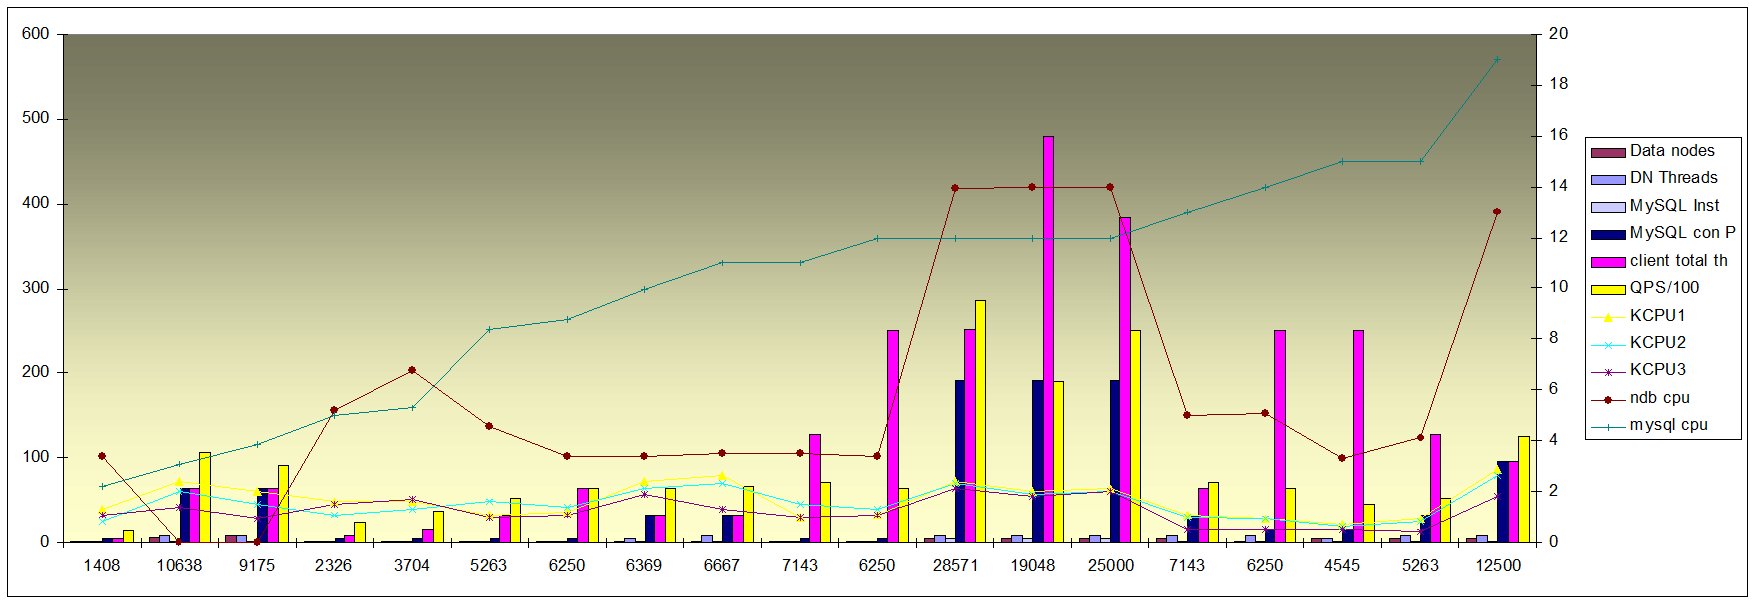
Data is sorted by MySQL cpu and NDB cpu usage and QPS.
From the data we can see that increasing the number of thread blindly could give some benefit.
But the highest performance comes when there is a good balance between, the MySQL connection pool to the Cluster, the
number of threads from the client application and the number of datanode/threads.
In this case the CPU usage will increase for the cluster kernel block, the cluster in general and the MySQL itself.
Important is not overloading the cluster pool because it will cause a drop of performance keeping the MySQL and Cluster busy for nothing.
Next exercise will be try to understand why it behave like this, what is bloking what from scaling MySQL conection pool or something inside the cluster?
Meanwhile let us try to put down some configuration numbers.
Scaling is good so if we have to handle large number of inserts, just do not waste our time and configure our application, MySQL and CLuster to use a large number of
threads.
assume we have a T2000 (we are talking of it) with 32 CPU (ahahaa ok let us not joke), assuming a good thread management from CMT, we can shoot as follow:
Client total application threads = (number of total CPUs x machines) x (4 double of the machine's number);
Cluster data node = Max 2 x machine for architectural good practics
Cluster data node threads = Well not joking here 8 the max (if we wil increase the number let increase the number of threads as well)
MySQL connection pool total = Client total application threads (if possible)
MySQL connection pool per server = 63
MySQL servers = MySQL connection pool total / 63
So in our case a good configuration will be:
Client total application threads = 248
Cluster data node = 4
Cluster data node threads = 8
Cluster data node threads Total = 32
MySQL connection pool total = 248
MySQL connection pool per server = 63
MySQL servers = 4 (3.9)
----------------------------------------------------
Few Notes
----------------------------------------------------
Limitation currently present:
MAX number of connection in the cluster is currently 254, which means that you must be very careful in setting up too many connection in the connection pool.
MAX number of connection per MySQL is 63.
Max number of threads in CLuster per data node is 8.
=========================================================================
What is blocking what?
=========================================================================
I am still working on it and I have to go into the code, but for the moment I have already identified few bad guys.
Unfortunately, bad guys are always the same, or at least it seems so.
I started to stress the server increasing the application threads, against a reduced number of Connection pool,
or against a reduced number of Data Nodes.
Again I had major issue when Connection pool was under dimensioned, with high CPU usage from MySQL or Cluster and limited performances.
So let focus on this.
Starting from this picture:
2009-11-26 17:38:53 [ndbd] INFO -- Angel pid: 13542 ndb pid: 13543
NDBMT: MaxNoOfExecutionThreads=8
NDBMT: workers=4 threads=4
2009-11-26 17:38:53 [ndbd] INFO -- NDB Cluster -- DB node 3
2009-11-26 17:38:53 [ndbd] INFO -- mysql-5.1.37 ndb-7.0.8a --
2009-11-26 17:38:53 [ndbd] INFO -- WatchDog timer is set to 6000 ms
2009-11-26 17:38:53 [ndbd] INFO -- Ndbd_mem_manager::init(1) min: 1566Mb initial: 1586Mb
Adding 1586Mb to ZONE_LO (1,50751)
NDBMT: num_threads=7
thr: 0 tid: 5 DBTC(0) DBDIH(0) DBDICT(0) NDBCNTR(0) QMGR(0) NDBFS(0) TRIX(0) DBUTIL(0)
thr: 1 tid: 6 BACKUP(0) DBLQH(0) DBACC(0) DBTUP(0) SUMA(0) DBTUX(0) TSMAN(0) LGMAN(0) PGMAN(0) RESTORE(0) DBINFO(0) PGMAN(5)
thr: 2 tid: 7 PGMAN(1) DBACC(1) DBLQH(1) DBTUP(1) BACKUP(1) DBTUX(1) RESTORE(1)
thr: 3 tid: 8 PGMAN(2) DBACC(2) DBLQH(2) DBTUP(2) BACKUP(2) DBTUX(2) RESTORE(2)
thr: 6 tid: 1 CMVMI(0)
thr: 4 tid: 9 PGMAN(3) DBACC(3) DBLQH(3) DBTUP(3) BACKUP(3) DBTUX(3) RESTORE(3)
saving 11e4c0000 at 100569948 (0)
thr: 5 tid: 10 PGMAN(4) DBACC(4) DBLQH(4) DBTUP(4) BACKUP(4) DBTUX(4) RESTORE(4)
2009-11-26 17:39:06 [ndbd] INFO -- Start initiated (mysql-5.1.37 ndb-7.0.8)
Total: 1 processes, 39 lwps, load averages: 14.20, 10.21, 8.65
PID USERNAME SIZE RSS STATE PRI NICE TIME CPU PROCESS/LWPID
13543 mt221861 3628M 1505M cpu22 10 0 1:20:24 2.9% ndbmtd/1
13543 mt221861 3628M 1505M cpu5 10 0 0:37:25 2.7% ndbmtd/5
13543 mt221861 3628M 1505M cpu12 40 0 0:31:10 2.1% ndbmtd/10
13543 mt221861 3628M 1505M cpu19 21 0 0:31:22 1.9% ndbmtd/9
13543 mt221861 3628M 1505M cpu0 20 0 0:31:34 1.8% ndbmtd/8
13543 mt221861 3628M 1505M sleep 50 0 0:31:20 1.7% ndbmtd/7
13543 mt221861 3628M 1505M sleep 58 0 0:23:50 0.1% ndbmtd/6
13543 mt221861 3628M 1505M sleep 59 0 0:00:00 0.0% ndbmtd/25
13543 mt221861 3628M 1505M sleep 59 0 0:00:57 0.0% ndbmtd/34
13543 mt221861 3628M 1505M sleep 59 0 0:00:00 0.0% ndbmtd/26
13543 mt221861 3628M 1505M sleep 59 0 0:00:53 0.0% ndbmtd/37
13543 mt221861 3628M 1505M sleep 59 0 0:00:54 0.0% ndbmtd/36
13543 mt221861 3628M 1505M sleep 59 0 0:00:53 0.0% ndbmtd/35
13543 mt221861 3628M 1505M sleep 59 0 0:00:00 0.0% ndbmtd/24
13543 mt221861 3628M 1505M sleep 59 0 0:00:00 0.0% ndbmtd/15
NLWP USERNAME SWAP RSS MEMORY TIME CPU
PID USERNAME SIZE RSS STATE PRI NICE TIME CPU PROCESS/NLWP
13543 mt221861 3628M 1533M cpu11 20 0 4:36:31 14% ndbmtd/39
14006 mt221861 3628M 1536M cpu9 10 0 4:38:20 13% ndbmtd/39
29385 mt221861 926M 507M sleep 59 0 0:23:38 12% mysqld/302
29522 mt221861 903M 501M sleep 54 0 0:23:46 12% mysqld/296
2773 mt221861 6640K 5784K sleep 59 0 0:00:56 1.6% marcospeed2/49
2774 mt221861 6648K 5792K sleep 59 0 0:00:55 1.6% marcospeed2/49
27854 mt221861 5248K 5136K sleep 59 0 0:02:59 0.2% prstat/1
2704 mt221861 4672K 4584K cpu2 59 0 0:00:03 0.0% prstat/1
1091 mt221861 9408K 4264K sleep 59 0 0:05:36 0.0% sshd/1
14005 mt221861 13M 6712K sleep 59 0 0:00:00 0.0% ndbmtd/1
1417 mt221861 5904K 4760K sleep 59 0 0:00:00 0.0% mysql/1
29388 mt221861 1520K 1496K sleep 59 0 0:00:00 0.0% mysqld_safe/1
8167 mt221861 3392K 3280K sleep 59 0 0:00:00 0.0% bash/1
29251 mt221861 1520K 1496K sleep 59 0 0:00:00 0.0% mysqld_safe/1
8165 mt221861 9408K 4120K sleep 59 0 0:00:00 0.0% sshd/1
4842 mt221861 9408K 4120K sleep 59 0 0:00:02 0.0% sshd/1
1093 mt221861 3392K 3288K sleep 59 0 0:00:00 0.0% bash/1
Total: 23 processes, 791 lwps, load averages: 18.29, 11.89, 9.32
----------------------------------------------------------------------------------
Going trough the process I have seen few errors, which are indicating mainly mutex global_lock.
Kernel blocks involvede:
10 PGMAN(4) DBACC(4) DBLQH(4) DBTUP(4) BACKUP(4) DBTUX(4) RESTORE(4)
[mt221861@vidar01]~/templates: truss -c -p 13543/10
^C
syscall seconds calls errors
lwp_park .345 4592 721
lwp_unpark .022 387
writev .244 2153
yield .001 33
clock_gettime .391 7407
-------- ------ ----
sys totals: 1.005 14572 721
usr time: 1.212
elapsed: 30.330
Kernel blocks involvede:
9 PGMAN(3) DBACC(3) DBLQH(3) DBTUP(3) BACKUP(3) DBTUX(3) RESTORE(3)
[mt221861@vidar01]~/templates: truss -c -p 13543/9
^C
syscall seconds calls errors
lwp_park .375 5081 508
lwp_unpark .022 414
writev .232 2326
yield .001 30
clock_gettime .472 9473
-------- ------ ----
sys totals: 1.104 17324 508
usr time: 1.305
elapsed: 30.360
Kernel blocks involvede:
7 PGMAN(1) DBACC(1) DBLQH(1) DBTUP(1) BACKUP(1) DBTUX(1) RESTORE(1)
[mt221861@vidar01]~/templates: truss -c -p 13543/7
^C
syscall seconds calls errors
lwp_park .471 6563 581
lwp_unpark .022 324
writev .357 3556
yield .002 39
clock_gettime .659 12425
-------- ------ ----
sys totals: 1.514 22907 581
usr time: 1.644
elapsed: 38.680
Kernel blocks involvede:
7 PGMAN(1) DBACC(1) DBLQH(1) DBTUP(1) BACKUP(1) DBTUX(1) RESTORE(1)
6 BACKUP(0) DBLQH(0) DBACC(0) DBTUP(0) SUMA(0) DBTUX(0) TSMAN(0) LGMAN(0) PGMAN(0) RESTORE(0) DBINFO(0) PGMAN(5)
[mt221861@vidar01]~/templates: truss -c -p 13543/6
^C
syscall seconds calls errors
lwp_park .387 5448 570
lwp_unpark .180 3056
writev .106 1174
yield .005 81
clock_gettime .334 6563
-------- ------ ----
sys totals: 1.014 16322 570
usr time: .363
elapsed: 30.580
I have found this interesting blog: http://blogs.sun.com/chrisg/entry/lwp_park_and_lwp_unpark
Interesting two parts:
"These system calls are, as their names imply, the calls that cause the current LWP to stop (park)
and allow the current LWP to allow another parked LWP to run (unpark).
The mutex global_lock is going to be battled over by all the threads that are created if one of
those threads needs to sleep, as it can't get the mutex, then it has to make a system call so that
it can stop using the CPU. The system call is lwp_park(). When the other thread, the one that has
the mutex, releases the mutex it signals the blocked thread using lwp_unpark(), with the LWP id of
the thread to which to start."
"However the truss can be a bit misleading. You have to remember that truss only reports on system
calls when the system call returns (unless they block long enough to be reported as sleeping).
So for a call like lwp_park which will sleep until there is a corresponding lwp_unpark call from
another thread. In the truss output above you can see this. LWP 2, on the first line in red calls
lwp_unpark(1) to unpark LWP 1, at this point LWP 1 returns from what was the blocked lwp_park()
call and continues on it's merry way. Alas as can be seen it does not get very far before it once
again finds itself blocked but that is what happens if your code is just fighting for a lock. "
So it seems that we have the same bad guy ... mutex!
Ok let see if I can find some more info about it.
While truss allow me to go for sun thread, I choose to use plockstat which do not allow you to do that
(or at least I was not able to do it).
Again some few interesting results come up. I run it first against mysqld then against one data node proces (ndbmtd).
*********************
MySQL
*********************
[mt221861@vidar01]~/templates: plockstat -s 8 -p 29385
^C
Mutex block
-------------------------------------------------------------------------------
Count nsec Lock Caller
21259 15873531 0x13a61f758 mysqld`__1cNha_ndbclusterSget_auto_increment6MXXXpX1_v_+0x90
which is:
Seconds 0,016
Milliseconds 15,874
Microseconds 15873,531
Nanoseconds 15873531
*********************
Cluster
*********************
[mt221861@vidar01]~/templates: plockstat -s 8 -p 13543
^C
Mutex block
-------------------------------------------------------------------------------
Count nsec Lock Caller
21 1011126 0x183a49bc8 ndbmtd`NdbMutex_Lock+0x18
-----------------------------------------------------------------------------------------------------
So it seems that major issues both side is how cluster prefech the autoincrement on MySQL and how
the mutex lock os handled on NDBMTD side.
I am NOT able now to confirm my assuption, but I will open some discussion with the development team and see.
The point is that we should really go inside the code and see.
==================================================================================================================
FULL TEST description in text mode (if you have enough time to go through) is here
==================================================================================================================
==================================================================================================================
SELECT results ....
==================================================================================================================
It will be a different chapter giving the wide possible combinations.
But I can say that from the test I have done, the configuration identified works well also for selects.
The kernel mainly stressed are obviously different (DBTC, DBLQH & PGMAN).
QPS where around 3 time the inserts fo simple select.
==================================================================================================================
That's all FOLKS for now, I will investigate more, and I already have more data but not yet ready to put it out.
==================================================================================================================
{joscommentenable}