The Galera Crossroads: Why PXC is the Lifeline for MariaDB Community Users
Or: Surviving the Codership Acquisition Without Losing Your Cluster
Why this long post?
Recently, the database landscape shifted significantly when MariaDB plc absorbed Codership. If you aren't familiar, Codership is the c ompany that introduced the Galera library and the WSREP API to MySQL, creating the first virtually synchronous replication solution for the MySQL ecosystem. For years, they produced their own highly stable, patched version of MySQL + Galera, which was widely adopted alongside solutions like Percona XtraDB Cluster (PXC).
The Post-Acquisition Landscape Following the acquisition, MariaDB plc made a controversial decision: they plan to phase out Galera from the MariaDB Community version and enhance it exclusively for MariaDB Enterprise.
This move sparked a lengthy debate. A large portion of the community pushed back, and even the MariaDB Foundation wasn't aligned with the decision (as detailed in this blog post by lefred).
However, looking at the Foundation's meeting minutes from February 25, 2026, it is clear they ultimately settled on "Option 2." This means the Foundation is willing to keep the existing Galera/WSREP code in the community server, but any future evolution or enhancement of the product will have to rely entirely on external community contributions.
What Does This Mean for You? The reality of the situation is straightforward:
- Codership is gone.
- MariaDB plc (the company) will transition the active development of Galera strictly to their Enterprise offering.
- The MariaDB Foundation will maintain the Galera code "as-is" unless the community actively steps up to provide updates.
As a result, users currently relying on the Codership version of Galera and, in my opinion, those using MariaDB Community may soon find themselves stuck in a difficult position, unsure of what steps to take next.
The Goal of This Document This post is meant to cut through the uncertainty and answer those lingering questions. My goal is to provide you with the facts so you can make an informed decision about your database architecture's future.
Below, you will find a detailed comparison between Percona XtraDB Cluster (based on Galera) and the MariaDB implementation to help you navigate this transition.
1. Executive Summary
Both Percona XtraDB Cluster (PXC) and MariaDB Galera Cluster share a common ancestor: the Galera synchronous multi-master replication library by Codership, PXC does not use the same Galera library as MariaDB. It uses the tracking fork of upstream Galera, and Percona adds many critical fixes that make it actually work in some places (IST stability, gcache, NBO, etc). They both implement the wsrep API and use the same Group Communication System (GCS) for write-set ordering. Despite this shared foundation, they are NOT binary-compatible and you cannot simply swap binaries between them.
The divergence stems from their server cores: PXC is built on Percona Server for MySQL (which closely tracks Oracle MySQL 8.x, 9.x), while MariaDB Galera is built on MariaDB Server, which forked from MySQL around 2010 and has since developed its own independent feature set, system tables, InnoDB patches, GTID implementation, and binary log format.
The gap has widened considerably since MySQL 8.0 introduced a new data dictionary stored entirely in InnoDB (eliminating .frm files), new authentication plugins, and native JSON type changes none of which exist in MariaDB's independent implementation.
2. Why You Cannot Simply Replace the Binaries
This is the most critical section for anyone considering migration. The following incompatibilities make a drop-in binary replacement impossible:
2.1 Data Dictionary and System Tables
MySQL 8.0 as such MySQL with Galera, (and PXC 8.0/8.4) replaced all .frm, .par, .opt, .trn, .trg files with a transactional data dictionary stored in InnoDB. MariaDB never adopted this. MariaDB 10.5 deprecated .frm files but uses its own internal frm-less representation. The system tables (mysql.user, mysql.tables_priv, mysql.columns_priv, mysql.routines, mysql.events, etc.) have fundamentally different schemas. Mounting a PXC data directory with a MariaDB binary will fail at startup and vice versa.
Concrete examples of schema divergence in mysql.user:
- PXC/MySQL 8.0 uses plugin-centric design; Password column was removed entirely
- MariaDB retains password column alongside authentication_string
- PXC defaults to caching_sha2_password; MariaDB defaults to mysql_native_password (10.6 LTS) or ed25519
2.2 GTID Format Incompatibility
GTID implementations are entirely different and mutually incompatible:
| Aspect | Percona XtraDB Cluster | MariaDB Galera Cluster |
| Format | server_uuid:seq_no (e.g. 6b07f8c7-...:1) | domain_id:server_id:seq_no (e.g. 0-1-100) |
| System variable | gtid_mode = ON/OFF/ON_PERMISSIVE | gtid_strict_mode = ON/OFF |
| Cluster GTID integration | wsrep generates UUID-based GTIDs automatically | Requires wsrep_gtid_mode + wsrep_gtid_domain_id |
| Replication positioning | MASTER_AUTO_POSITION=1 | MASTER_USE_GTID = slave_pos / current_pos |
| Cross-product GTID replication | Cannot replicate to/from MariaDB using GTID | Cannot replicate to/from MySQL 8.x using GTID |
| Binlog GTID events | Gtid_log_event format | Gtid_list_log_event incompatible wire format |
Any DR topology crossing PXC and MariaDB must use file+position-based replication or purpose-built ETL tools. GTID-based replication between them does not work.
2.3 InnoDB / XtraDB Divergence
- InnoDB tablespace format: MySQL 8.0 uses a newer undo tablespace design (undo001/undo002) absent in MariaDB
- Redo log format: MySQL 8.0.30+ uses a new circular redo log; MariaDB uses its own format since 10.5
- innodb_autoinc_lock_mode: PXC enforces mode=2 via pxc_strict_mode; MariaDB defaults to mode=1 this alone causes certification failures if uncorrected
- Row format checksums and internal page structures differ between the two InnoDB forks
2.4 Binary Log Format Enforcement
PXC 8.0 hardcodes ROW-based binary logging. Setting binlog_format=STATEMENT or MIXED raises an error regardless of pxc_strict_mode:
ERROR: --binlog-format=STATEMENT is not supported. Use ROW.
MariaDB Galera warns but can run with MIXED format in some scenarios, which risks non-deterministic replication.
2.5 wsrep API and Patch Divergence
| Aspect | Percona XtraDB Cluster | MariaDB Galera Cluster |
| Galera library | Galera 4.x, separate package (libgalera_smm.so) | Galera 4.x, embedded in server package since 10.1 |
| wsrep activation | Active when wsrep_provider path is configured | Requires explicit wsrep_on=ON in my.cnf |
| Extra status variables | 10 PXC-specific wsrep_* variables | 1 extra: wsrep_thread_count |
| Extra config variables | pxc_strict_mode, pxc_encrypt_cluster_traffic, pxc_maint_mode, wsrep_reject_queries | wsrep_gtid_mode, wsrep_gtid_domain_id, wsrep_patch_version, wsrep_mysql_replication_bundle |
2.6 JSON, SQL Modes, and Reserved Words
MySQL 8.0 stores JSON as a native binary type. MariaDB stores JSON as longtext with a CHECK constraint. Tables with JSON columns cannot be physically migrated logical exports (mysqldump) are required and may need schema adjustments. Numerous SQL modes and reserved words differ, causing silent behavioral differences that surface only in application testing.
3. Architecture and Replication Internals
Both products share the same fundamental architecture: a database server patched with the wsrep API communicates with the Galera plugin (libgalera_smm.so), which handles Group Communication via the Totem Single Ring Ordering protocol and write-set certification.
3.1 Write-Set Replication Flow
The flow is identical because it is implemented in the shared Galera library:
- Transaction executes locally; InnoDB registers each modified row key via wsrep append_key()
- On COMMIT: wsrep packages row keys + binary log event as a write-set (WS)
- WS is sent to GCS, which assigns a global sequence number (seqno) and broadcasts to all nodes
- Every node independently certifies the WS against its local Certification Conflict Vector (cert_index_ng)
- Conflict (same row key at overlapping seqno range): certification fails → ERROR 1213 Deadlock
- Pass: WS applied via applier thread; certification is deterministic every node reaches the same decision
Galera uses optimistic locking at the cluster level, pessimistic locking locally.
A transaction acquires row locks on the originating node (standard InnoDB pessimistic locking) but has no visibility into locks on other nodes. Conflicts are detected only at commit time.
3.2 Brute Force Abort
When an incoming replicated write-set conflicts with a local uncommitted transaction, the incoming write-set always wins. The local transaction is rolled back immediately and the client receives ERROR 1213. Applications must implement retry logic this is not optional for multi-writer topologies. Both products behave identically here; the difference is in monitoring granularity (PXC exposes wsrep_local_bf_aborts and wsrep_local_cert_failures).
4. Flow Control
Flow Control (FC) is the back-pressure mechanism that prevents fast writers from overwhelming slow appliers. When a node's receive queue exceeds gcs.fc_limit, it broadcasts a FLOW_CONTROL_PAUSE message to the entire cluster. All nodes suspend committing until the queue drains below gcs.fc_factor × gcs.fc_limit.
- FC is cluster-global: when ONE node pauses, ALL nodes stop committing
- Creates latency spikes visible to all applications on all nodes
- The pausing node continues applying its backlog during FC
- Frequent FC indicates the cluster is write-bound beyond what the slowest node can absorb
4.1 Observability PXC vs MariaDB
| Aspect | Percona XtraDB Cluster | MariaDB Galera Cluster |
| wsrep_flow_control_paused | Available fraction of time in FC | Available in both Enterprise and community |
| wsrep_flow_control_sent/recv | Available | Available in both Enterprise and community |
| wsrep_flow_control_status | PXC ONLY ON or OFF right now | Not available |
| wsrep_flow_control_interval | PXC ONLY current [low, high] range | Not available |
| wsrep_flow_control_interval_low/high | PXC ONLY individual thresholds | Not available |
| wsrep_cert_bucket_count | PXC ONLY cert index hash buckets | Not available |
| wsrep_gcache_pool_size | PXC ONLY gcache memory in use | Not available |
| wsrep_ist_receive_seqno_* | PXC ONLY IST progress (start/current/end) | Not available |
4.2 Key FC Tuning Variables (both products)
| wsrep_provider_options key | Default | Effect |
| gcs.fc_limit | 100 | Recv queue depth that triggers FC pause. Raise for bursty writers. |
| gcs.fc_factor | 1.0 | Queue must drop below fc_limit × fc_factor to resume. Lower = resumes sooner. |
| gcs.fc_master_slave | no | Set yes for single-writer topology to disable FC on the writer node. |
| gcs.max_packet_size | 64500 | Max GCS packet size. Set larger than your largest expected write-set. |
5. Streaming Replication and Large Transaction Handling
Streaming Replication (SR) is a Galera 4 feature available in both PXC 8.0+ and MariaDB 10.4+. It splits large transactions into fragments that are replicated and certified before the final COMMIT.
Without SR: A 1M-row UPDATE runs entirely on one node. At commit, the entire write-set is sent. Other nodes stall 28–30 seconds certifying and applying it. All unrelated writes cluster-wide are blocked during this window.
With SR (wsrep_trx_fragment_size > 0): Fragments are replicated mid-transaction. Each certified fragment acquires row locks on ALL nodes, providing cluster-wide row-level locking during the transaction. Conflicting transactions on other nodes WAIT rather than certifying and failing later.
The trade-off: Galera double-writes fragments to mysql.wsrep_streaming_log (an InnoDB table). A 34-second update without SR takes 40 seconds with 1MB fragments, and 51 seconds with 0.1MB fragments. Fragment rollback propagates to all nodes more expensive than a local-only rollback.
| Variable | Values | Notes |
| wsrep_trx_fragment_size | 0 (off), N | Fragment size in units of wsrep_trx_fragment_unit |
| wsrep_trx_fragment_unit | bytes, rows, statements | Recommend bytes; 1MB is a reasonable starting point for most workloads |
| Session-scope only | Yes | Do not enable globally. Enable per-session for known large transactions only. |
No difference between PXC and MariaDB on SR it is identical Galera 4 library behavior in both.
6. Split Brain, Quorum, and Primary Component
Split-brain protection is implemented identically in both products via the Galera GCS layer.
6.1 Primary Component Election
When a network partition occurs, each segment runs a membership algorithm. The segment with strictly more than 50% of cluster weight becomes the Primary Component (PC). Minority segments enter non-primary state:
- All writes rejected: ERROR 1047 WSREP has not yet prepared node for application use
- Reads permitted (effectively read-only)
- Node waits until network heals and PC is re-established
6.2 Garbd Arbitrator
For 2-node or even-node clusters, garbd is a lightweight voting member without data storage. Both products ship it. Mixing garbd binaries from PXC and MariaDB in the same cluster is not recommended due to potential wsrep API version differences.
6.3 Node Weighting (pc.weight)
Both products support pc.weight in wsrep_provider_options to assign higher votes to specific nodes. Use this to prioritize primary datacenter nodes over DR nodes in quorum calculations preventing the DR site from forming a spurious PC if the link to the primary drops.
6.4 Split-Brain Recovery
- Identify the most advanced node: inspect grastate.dat and the seqno field
- The node with safe_to_bootstrap: 1 was the last to write cleanly
- Bootstrap from it: SET GLOBAL wsrep_provider_options="pc.bootstrap=YES"; or restart with --wsrep-new-cluster
- Re-provision all other nodes via SST from the bootstrapped node (losing diverged writes)
- Verify with pt-table-checksum after cluster reform
PXC-specific advantage: pxc_maint_mode. Provides DISABLED / PXCMAINT / MAINTENANCE states. PXCMAINT signals load balancers to drain the node gracefully before maintenance. MariaDB has no equivalent HAProxy/ProxySQL coordination that must be done externally.
7. State Transfer: SST and IST
7.1 IST (Incremental State Transfer)
Used when a node rejoins after a short absence and the donor's gcache still contains the missing write-sets. Fast and non-blocking to donor. Mechanism is identical in both. PXC adds monitoring:
- wsrep_ist_receive_status: text description of IST state
- wsrep_ist_receive_seqno_start / current / end: enables building a completion percentage
MariaDB provides none of these; IST progress requires log file grepping.
7.2 SST (Full State Transfer)
| Aspect | Percona XtraDB Cluster | MariaDB Galera Cluster | Impact |
| Default method | xtrabackup-v2 | mariabackup (recommended) | Both are production-grade |
| CLONE SST | YES native MySQL CLONE plugin; no external binary; encrypted by default | NO not available in MariaDB | PXC can provision a new node with zero external tooling; MariaDB always requires mariabackup binary installed and configured on all nodes |
| Backup tool | Percona XtraBackup (xtrabackup) | MariaDB Backup (mariabackup, fork of xtrabackup 2.3) | The tools are incompatible. PXC's backup files cannot be restored by mariabackup and vice versa. Migration between the two products requires a full logical dump, not a physical copy |
| Cross-product SST | xtrabackup CANNOT restore MariaDB data | mariabackup CANNOT restore PXC data | Hard blocker for any hybrid topology or live migration attempt using physical SST. Reinforces that the two clusters cannot share nodes |
| Donor blocking | CLONE: non-blocking to read. xtrabackup: --lock-ddl=REDUCED even DDLs don't block the donor | mariabackup: brief FTWRL, then non-blocking | Operationally equivalent for xtrabackup vs mariabackup paths. CLONE and new option in PXC eliminates even the brief lock, making it preferable for write-sensitive donors |
| wsrep_allowlist | PXC 8.0+ IP allowlist for SST/IST requests | Not available in MariaDB Galera | Without an allowlist, any node that knows the cluster address can request an SST, increasing the attack surface. PXC allows hardening this at the database layer; MariaDB relies entirely on network-level controls |
| Encryption | pxc_encrypt_cluster_traffic covers SST automatically | Requires separate SSL config per SST method | In MariaDB, SST encryption is configured independently from replication traffic encryption. A misconfiguration (e.g. TLS enabled for write-sets but forgotten for SST) silently transfers a full data snapshot in plaintext — a common security gap. PXC's single-variable approach eliminates this risk by default |
8. DDL Handling and Online Schema Changes
Schema changes are the most operationally dangerous operations in Galera. Both products support three mechanisms via wsrep_OSU_method.
8.1 TOI Total Order Isolation (default)
DDL is executed across all nodes in global total order. Every node pauses at the same logical point, applies the DDL, then resumes. Safe but causes cluster-wide stall for the DDL duration. For large tables this means minutes of downtime. Identical behavior in both products.
8.2 RSU Rolling Schema Upgrade
Desynchronizes one node (wsrep_desync=ON), applies DDL locally, then re-syncs. Cluster continues processing during upgrade on that node. Risk: schema is temporarily inconsistent across nodes. Identical behavior in both products.
8.3 NBO Non-Blocking Operation (KEY DIFFERENCE)
NBO acquires a metadata lock only at the very start and very end of the DDL. The DDL executes independently on each node while the cluster processes other statements normally.
- PXC 8.0.25+ (Community / Open Source): NBO is fully supported for CREATE/ALTER/DROP INDEX and ALTER TABLE index operations. Available at no cost in the standard community release.
- MariaDB Galera (Enterprise Only): NBO is restricted to MariaDB Enterprise Server. The community edition does NOT support NBO only TOI and RSU are available. This is a significant operational disadvantage for large table DDL in production.
External tools for Galera-safe DDL:
- pt-online-schema-change: works with Galera, requires pxc_strict_mode=PERMISSIVE during execution (PXC), careful configuration
9. Disaster Recovery Architectures
Galera provides a synchronous multi-master within a cluster. For DR across geographic sites, both products rely on asynchronous MySQL replication. The GTID incompatibility is the main constraint.
9.1 Async Replica as DR Node
Standard DR pattern: async replica in DR site replicates from one Galera node. Requirements for both products:
- log_slave_updates = ON on all cluster nodes (cluster writes must reach binlog for async replicas)
- binlog_format = ROW (enforced by PXC; must be set explicitly in MariaDB)
Critical: DR replica must be the same product family. A PXC cluster cannot replicate to a MariaDB DR node via GTID (format mismatch). File+position replication is possible but loses GTID safety. In practice: PXC → Percona Server/PXC DR; MariaDB → MariaDB Server DR.
9.2 Geo-Distributed Galera
Galera can technically span datacenters, but WAN latency adds directly to commit latency (certification is synchronous). At 20ms RTT, every write adds 20ms to commit time. Both products are equally affected. Mitigation: tune evs.* provider options for WAN tolerance. However for most kinds of workloads, async replication between sites is a must to geo-distributed Galera.
9.3 PMM Integration
PXC integrates natively with Percona Monitoring and Management (PMM), providing built-in Galera dashboards, flow control visualization, write-set lag tracking, and cluster state alerting. MariaDB Galera can be monitored by PMM but requires additional dashboard configuration and custom exporters for full visibility.
10. PXC-Specific Features
10.1 pxc_strict_mode
Performs safety validations at startup and runtime. Modes: ENFORCING (default), PERMISSIVE, DISABLED.
ENFORCING blocks:
- MyISAM DML (would not replicate, causing silent data divergence)
- Tables without primary keys (certification is key-based; no PK causes full-table locks in certification)
- Non-ROW binlog_format
- log_output=FILE (can impact applier performance)
- innodb_autoinc_lock_mode != 2 (mode 1 can cause gaps/deadlocks in multi-master)
MariaDB has no equivalent. Without this enforcement, operators can accidentally run MyISAM writes or INSERT into a table without a PK on a MariaDB node and the operation silently succeeds locally but is not replicated, causing cluster data divergence.
10.2 pxc_encrypt_cluster_traffic
A single variable (ON by default in PXC 8.0) that enables TLS for ALL cluster traffic: write-set replication, SST, IST, and internal service messages. In MariaDB Galera, each of these requires separate SSL configuration. Misconfiguration can leave SST traffic unencrypted while write-set traffic is encrypted a common security gap in MariaDB Galera deployments.
10.3 CLONE SST Plugin
PXC's CLONE SST (default since 8.0.41) requires no external backup tool, uses MySQL's native encryption, and is non-blocking for reads on the donor. Node provisioning is simpler, faster for smaller datasets, and requires no xtrabackup binary installation.
10.4 GCache and Write-Set Cache Encryption
Introduced in PXC 8.0.31-23. Currently a tech preview feature.
What it does: Encrypts two on-disk structures that Galera uses to buffer replication data:
GCache (RingBuffer file) the persistent on-disk write-set cache used for IST. Encryption uses a two-layer key scheme: the Keyring stores only a Master Key, which encrypts a per-file File Key. The encrypted File Key is stored in the RingBuffer's preamble. Since the RingBuffer is non-volatile (survives restarts), the File Key must be retrievable from the preamble on restart.
Write-Set cache (allocator disk pages) temporary disk pages spilled during large transactions. These are ephemeral (not persistent across restarts), so no File Key is stored encryption is in-memory-keyed only.
How to enable via wsrep_provider_options:
| Variable | Default | Controls |
| gcache.encryption | off | Enable/disable GCache encryption |
| gcache.encryption_cache_size | 16MB | Encryption cache size (max 512 pages) |
| gcache.encryption_cache_page_size | 32KB | Must be a multiple of CPU page size (typically 4KB) |
| allocator.disk_pages_encryption | off | Enable/disable Write-Set cache encryption |
| allocator.encryption_cache_size | 16MB | Same structure as GCache |
| allocator.encryption_cache_page_size | 32KB | Same constraint |
Master Key rotation:
sql
ALTER INSTANCE ROTATE GCACHE MASTER KEY;
Requires a keyring plugin or keyring component (e.g. keyring_file, keyring_vault) loaded and configured. The keyring file should be stored outside the data directory.
GCache and Write-Set Cache Encryption
10.5 FC Auto Eviction of Lagging Nodes
Introduced in PXC 8.0.33-25 (PXC-3760).
The problem it solves: When a node is persistently slow, it drives Flow Control (FC) for the entire cluster, throttling all writes. Previously, operators had to manually evict such a node. This feature makes the node evict itself when it has been in FC too long.
How it works: A sliding time window tracks FC activity. If FC time within that window exceeds a threshold ratio, the node self-leaves the cluster.
Variables (set via wsrep_provider_options, both static require restart):
| Variable | Default | Description |
| gcs.fc_auto_evict_window | 0 (disabled) | Width of the observation window (seconds). 0 = feature off. |
| gcs.fc_auto_evict_threshold | 0.75 | Ratio (0.0–1.0): if FC time ÷ window ≥ this value, node self-evicts. |
Example: With gcs.fc_auto_evict_window=60 and gcs.fc_auto_evict_threshold=0.75, if a node spends ≥ 45 seconds of any 60-second window in FC, it leaves the cluster automatically.
There is also the older, separate EVS-level auto eviction:
| Variable | Default | Description |
| evs.auto_evict | 0 (disabled) | Number of delayed-list entries allowed before EVS auto-evicts a slow node. Requires evs.version=1. |
| evs.evict | Manual eviction: set to a node's UUID to force evict it. | |
| evs.delay_margin | PT1S | How long a node can lag before being added to the delayed list. |
11. MariaDB Galera-Specific Features
11.1 wsrep_gtid_mode and wsrep_gtid_domain_id
MariaDB's GTID integration with Galera is more explicit. wsrep_gtid_mode=ON ensures all Galera write-sets carry consistent MariaDB GTIDs using the domain from wsrep_gtid_domain_id. Critical for async replication topologies where downstream replicas need GTID-based position tracking. PXC handles this automatically via MySQL's native GTID integration in the wsrep patch.
11.2 WSREP_INFO Plugin
MariaDB contributed the WSREP_INFO plugin, which exposes cluster membership as queryable information_schema tables:
SELECT * FROM information_schema.WSREP_MEMBERSHIP;
SELECT * FROM information_schema.WSREP_STATUS;
More ergonomic than parsing SHOW STATUS LIKE 'wsrep%'. PXC achieves equivalent visibility through status variables and PMM but does not have these information_schema tables natively.
11.3 Embedded Galera and Simplified Installation
Since MariaDB 10.1, Galera support is embedded in the server package (no separate galera lib install). Activated by wsrep_on=ON. PXC ships libgalera_smm.so as a separate package alongside the server package. Operationally minor, but reduces packaging complexity in some deployment automation scenarios.
11.4 MariaDB-Unique Database Features
MariaDB Galera supports several features PXC/MySQL 8.x does not have:
- System-Versioned Tables (temporal tables, SQL:2011 standard) work with Galera replication
- Sequence objects (CREATE SEQUENCE)
- Spider storage engine for horizontal sharding
- COMPRESS() / UNCOMPRESS() improvements
- Different JSON implementation (LONGTEXT + CHECK) more portable but less performant for JSON operations
12. Performance Characteristics
12.1 Write Throughput and Concurrency Scaling
Both impose identical write amplification: every write executes on every node. Server-level performance differences:
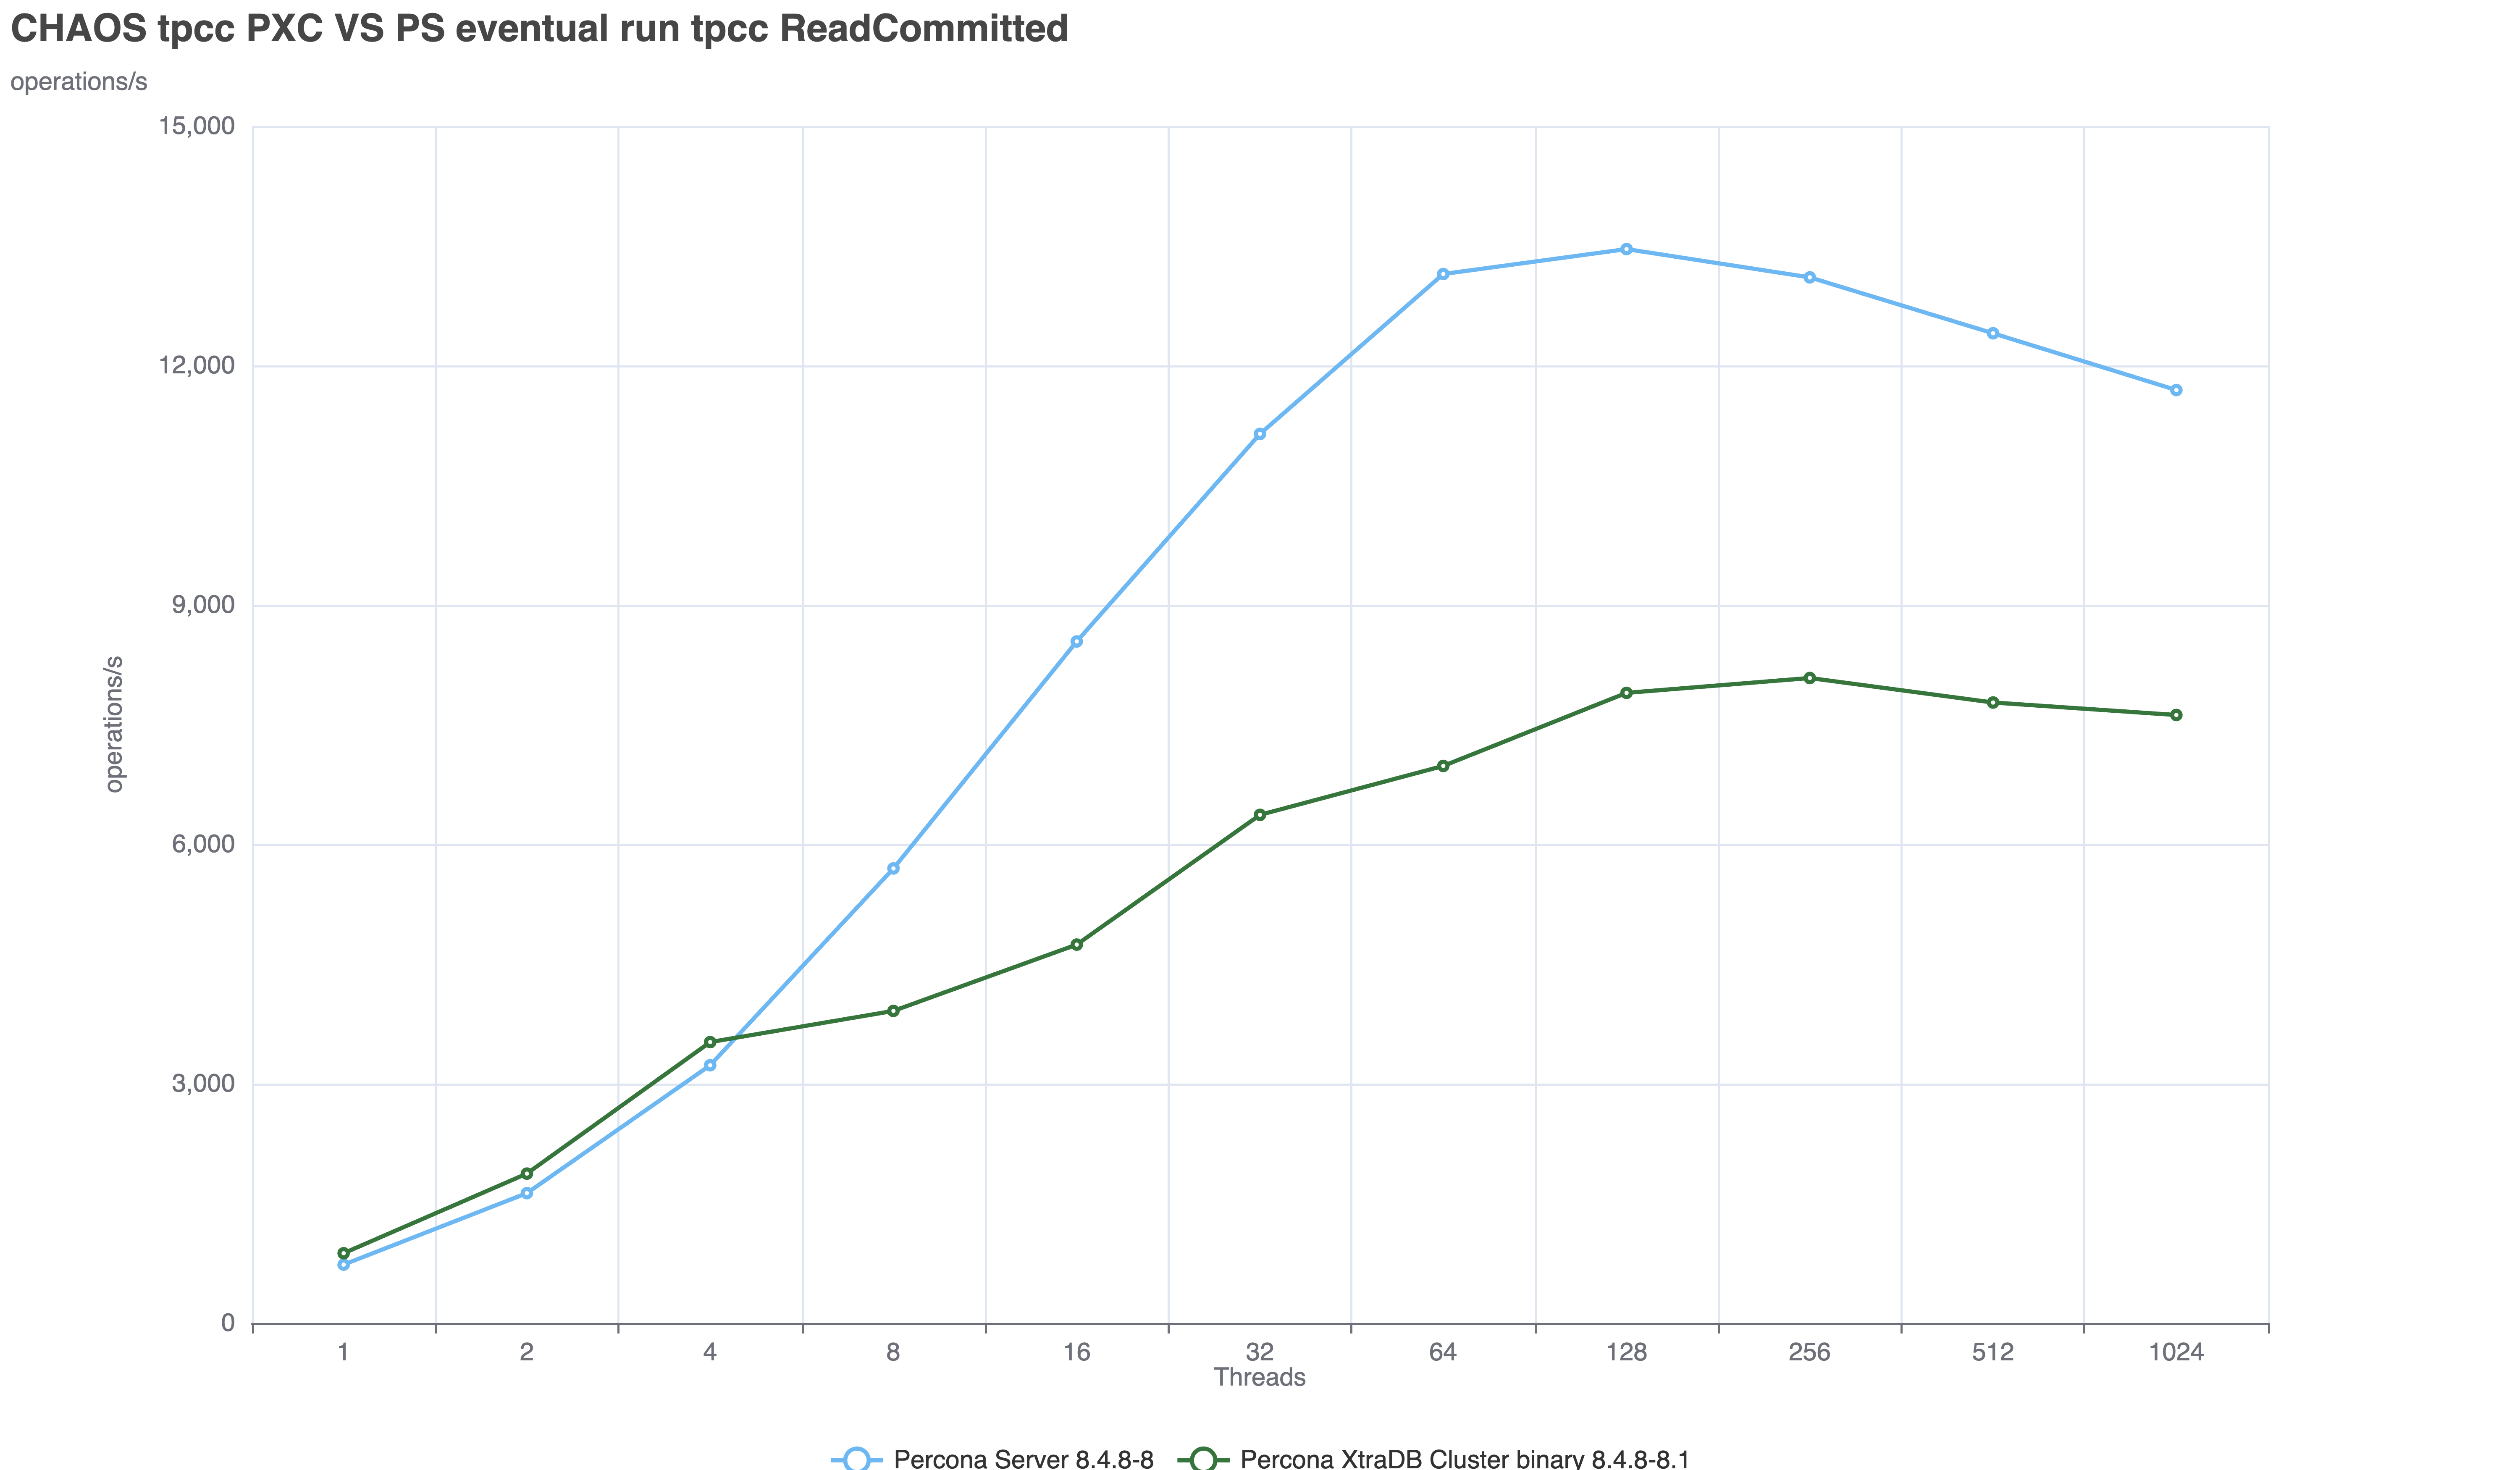
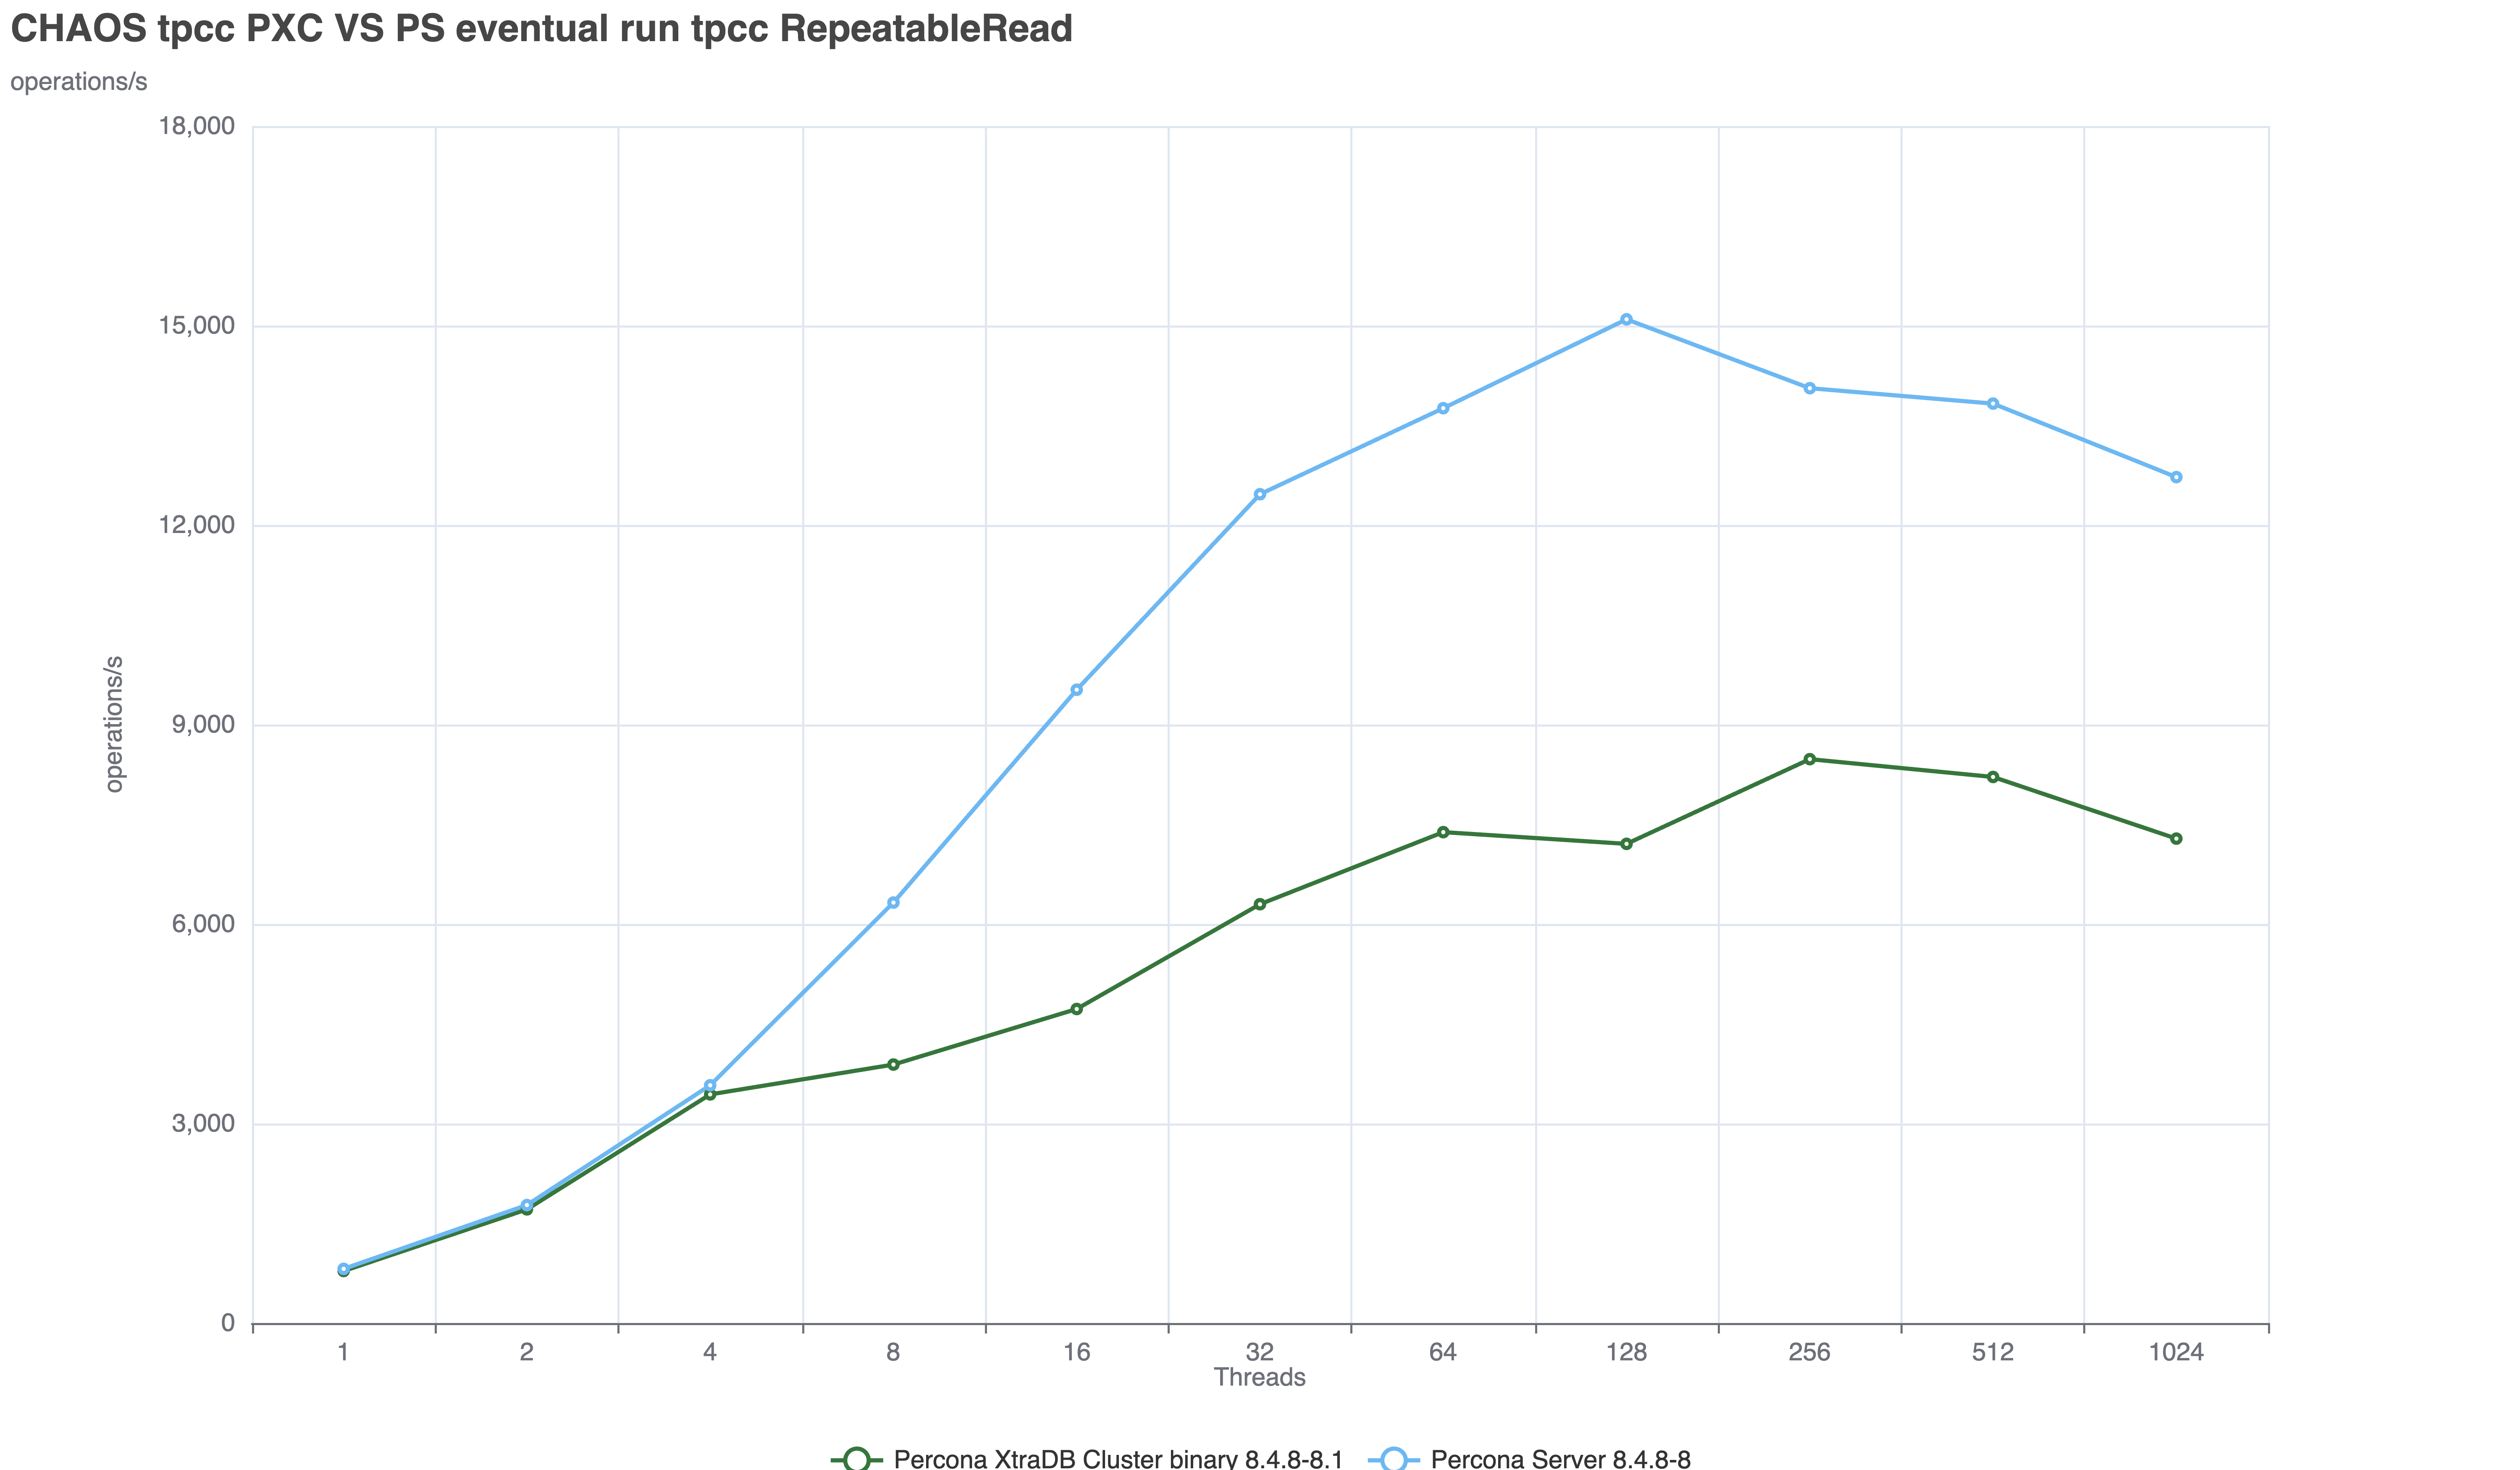
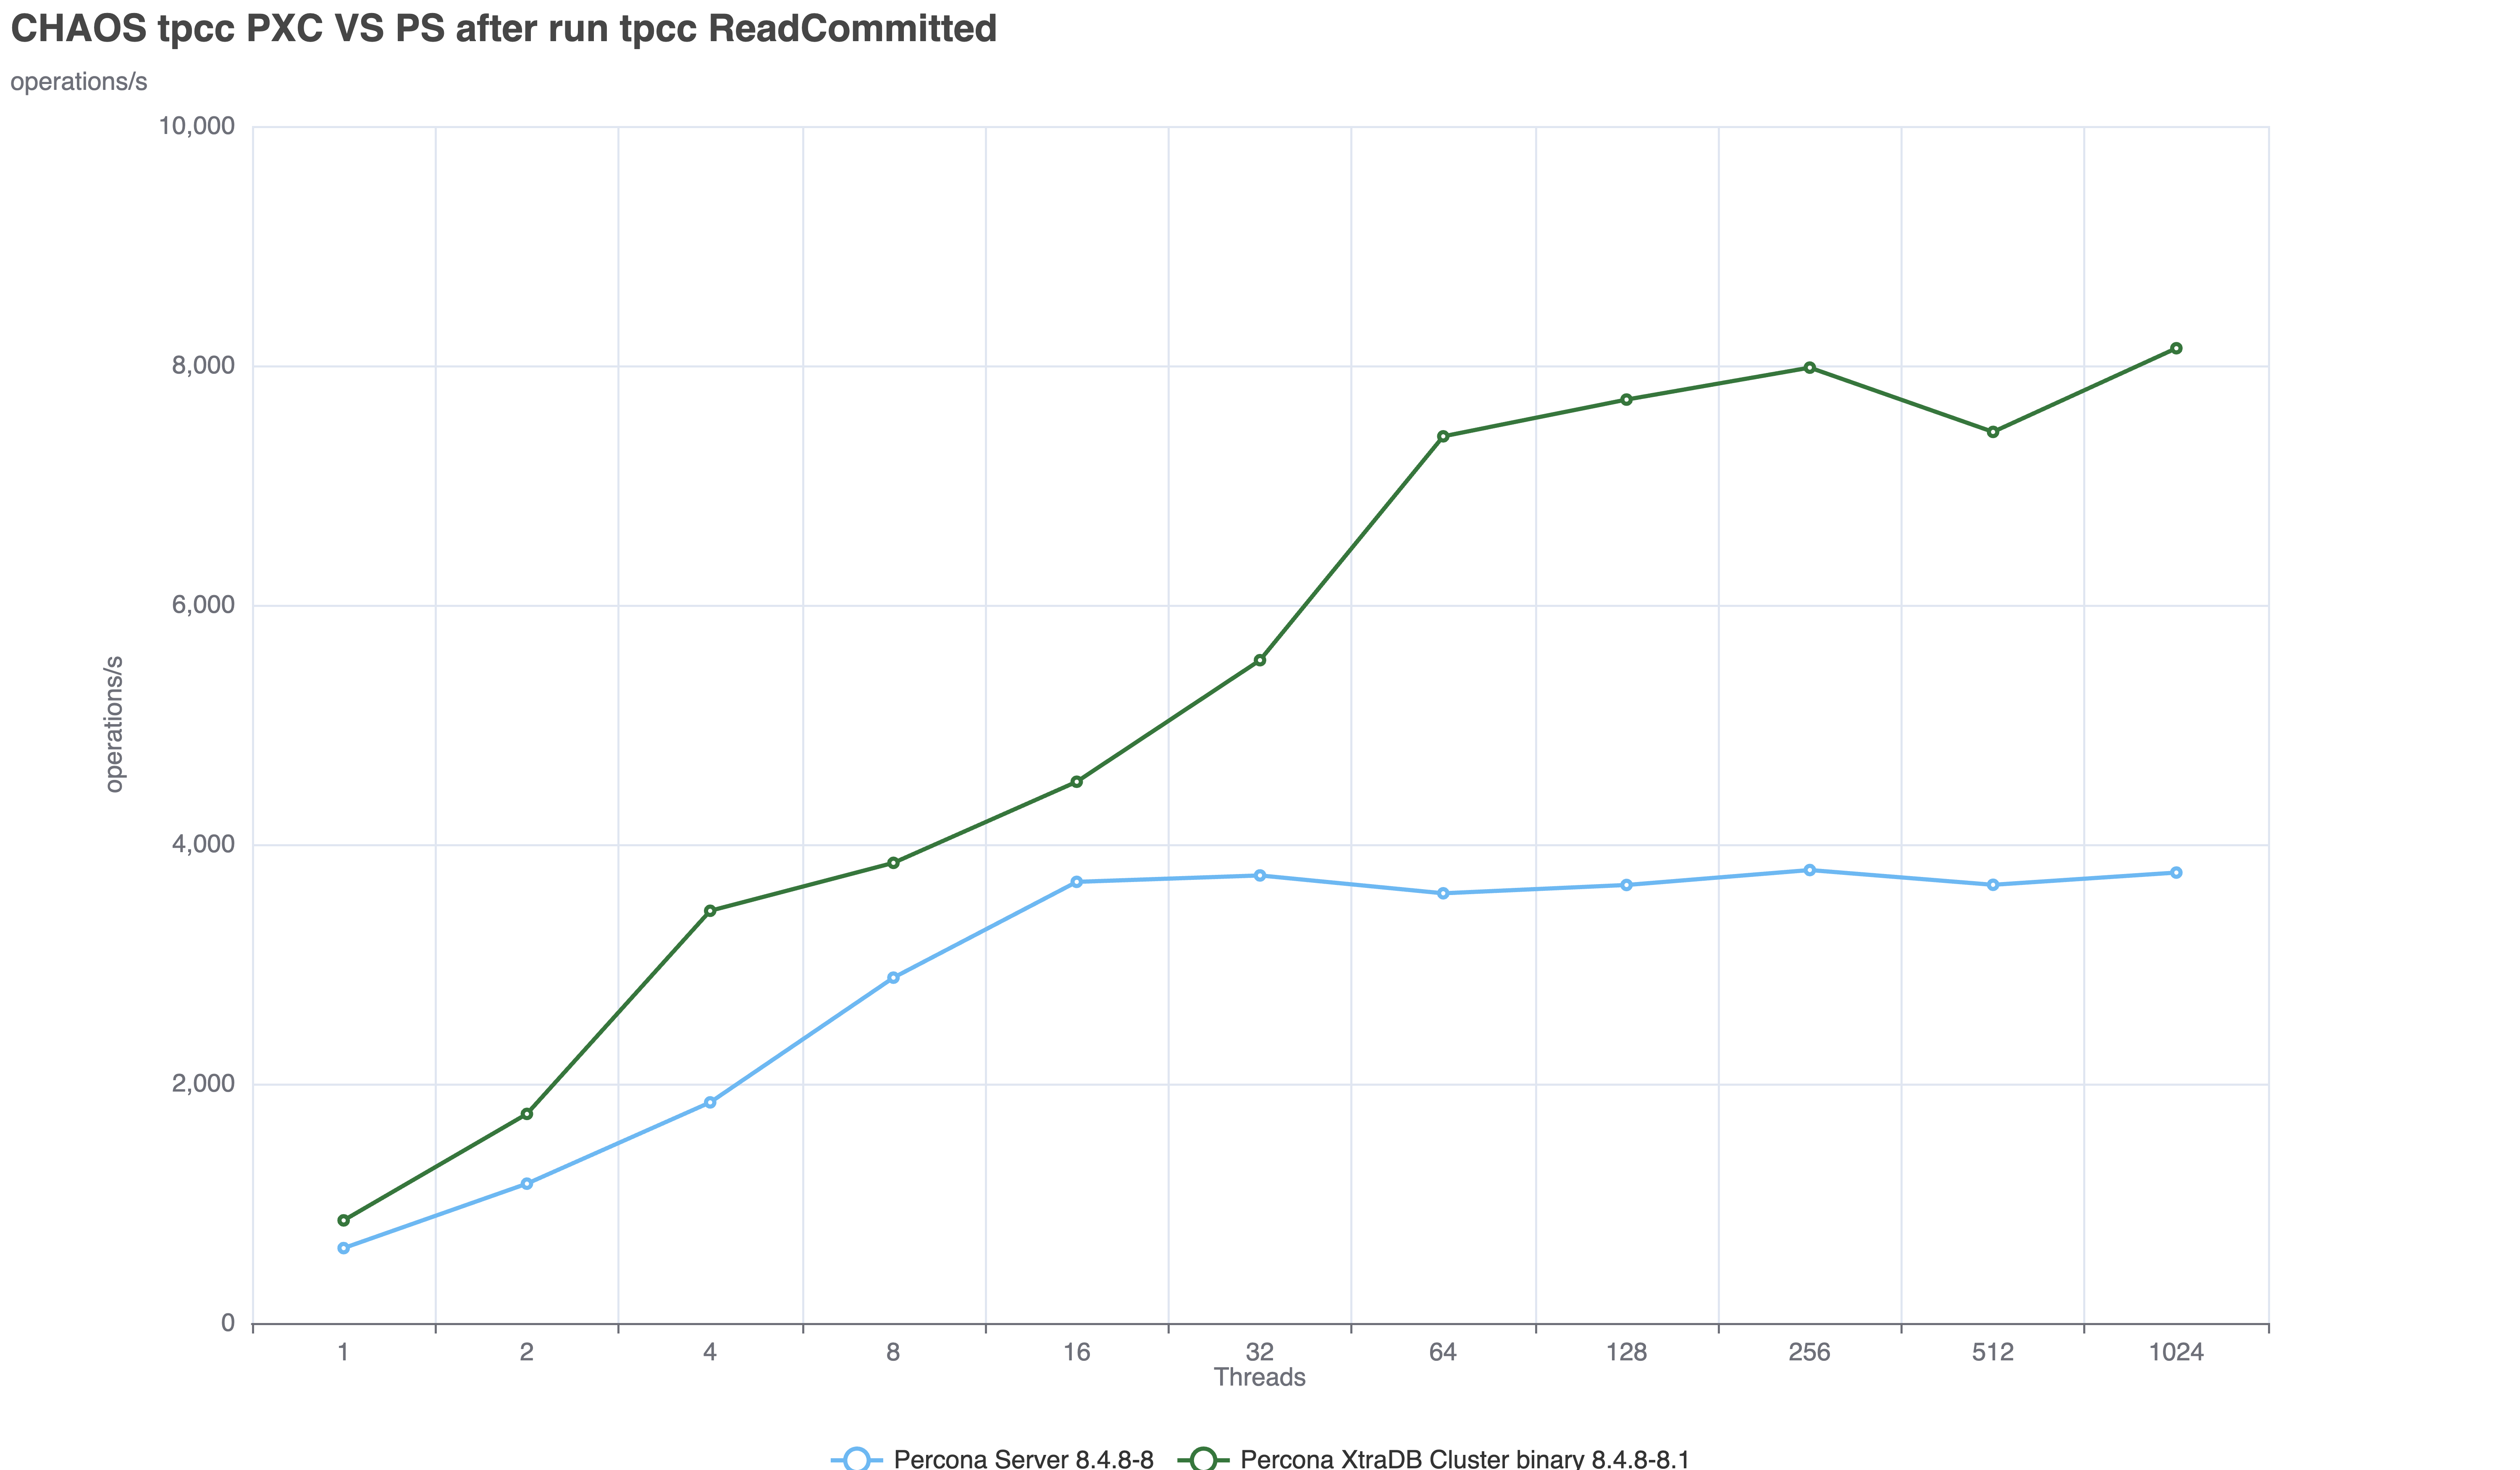
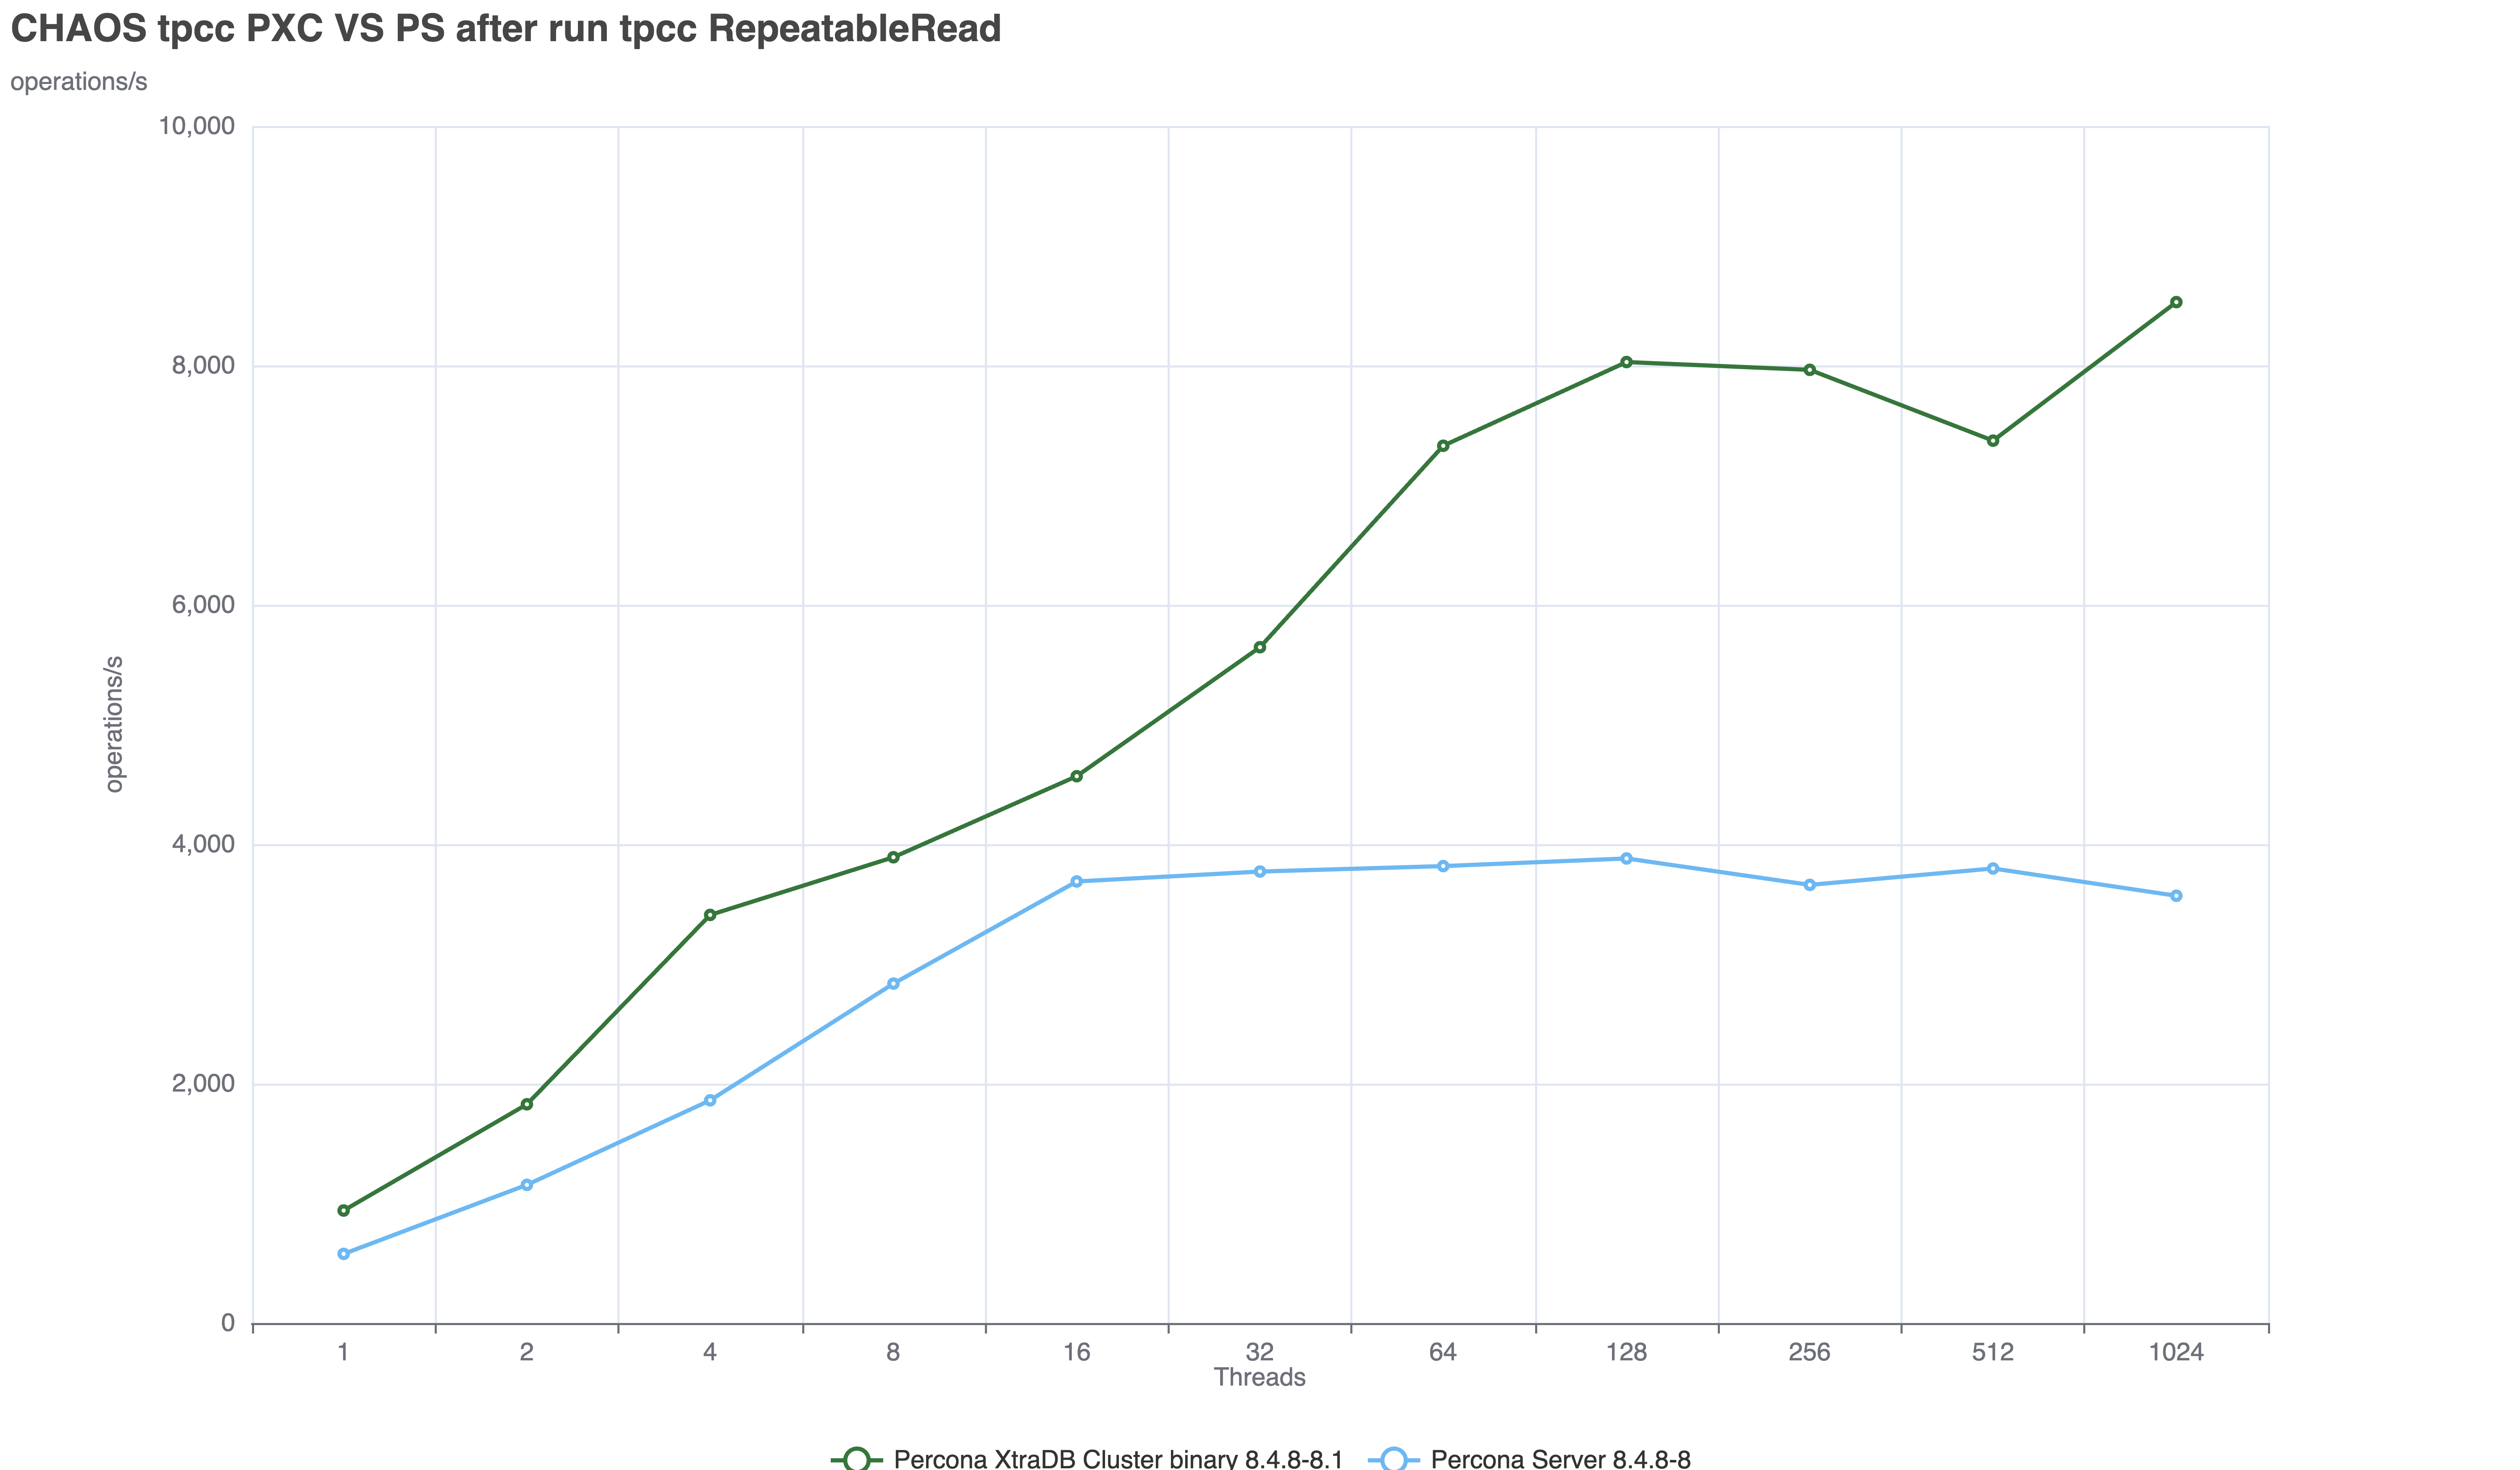
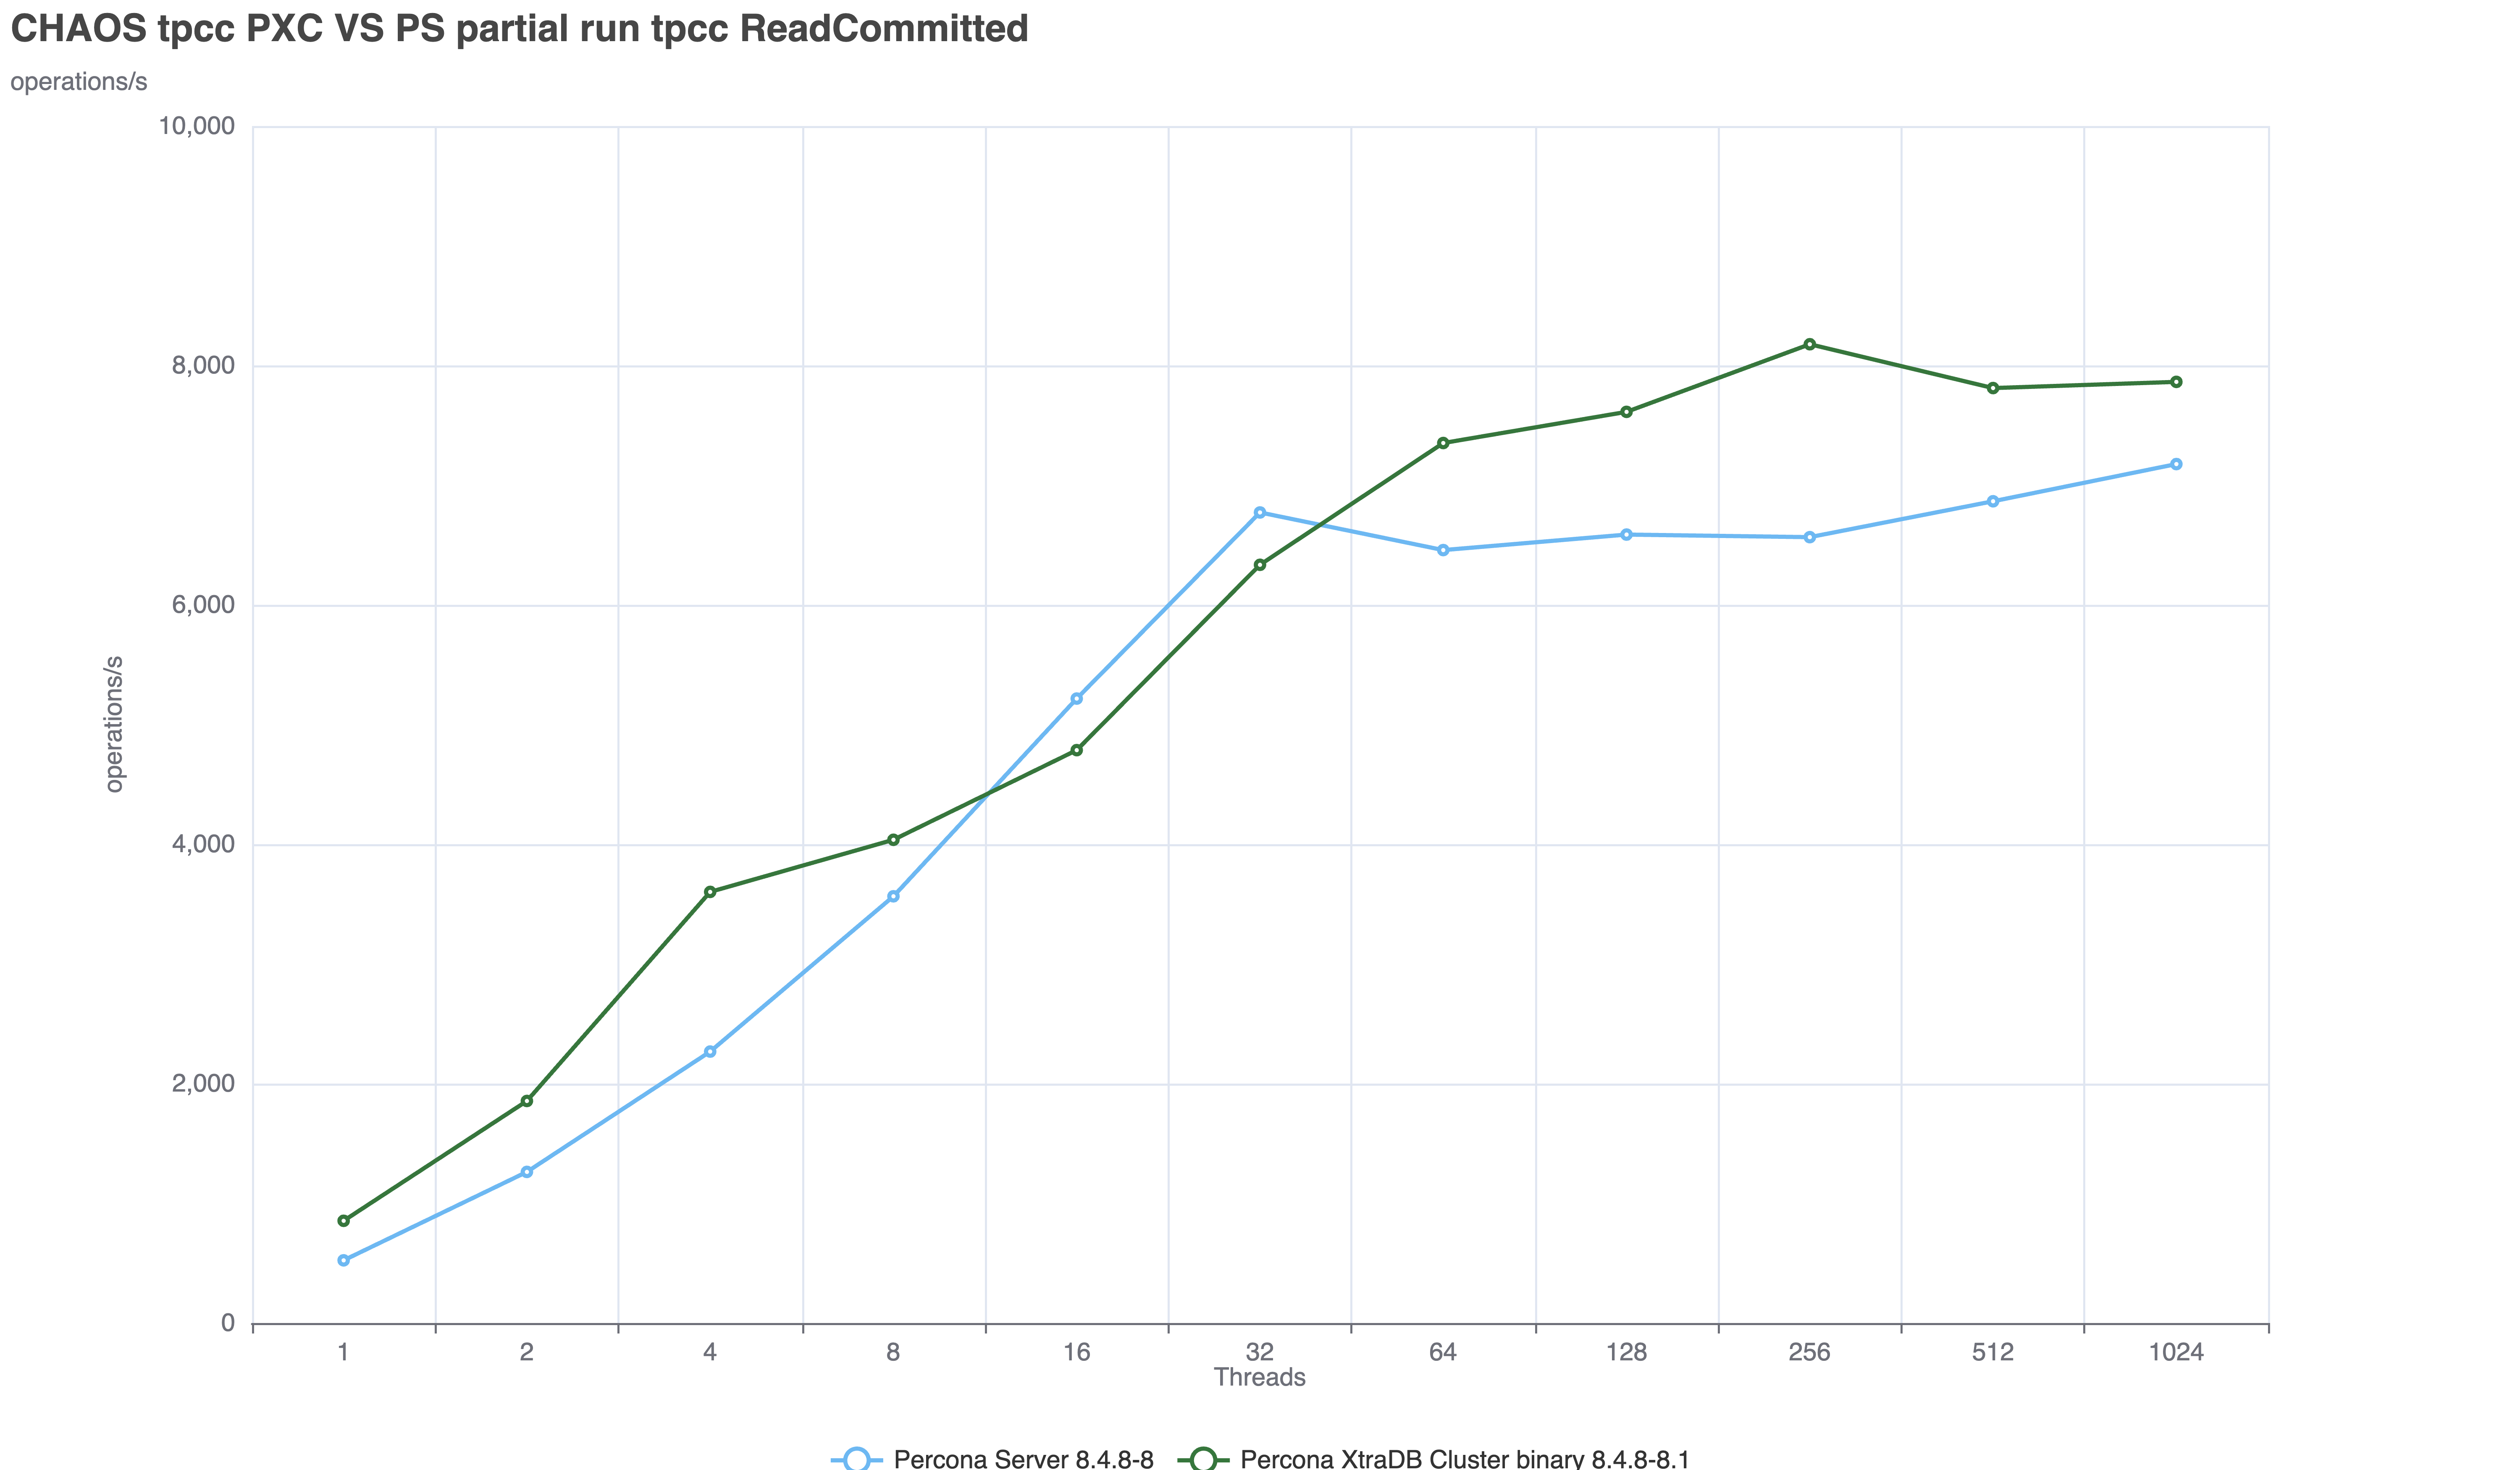
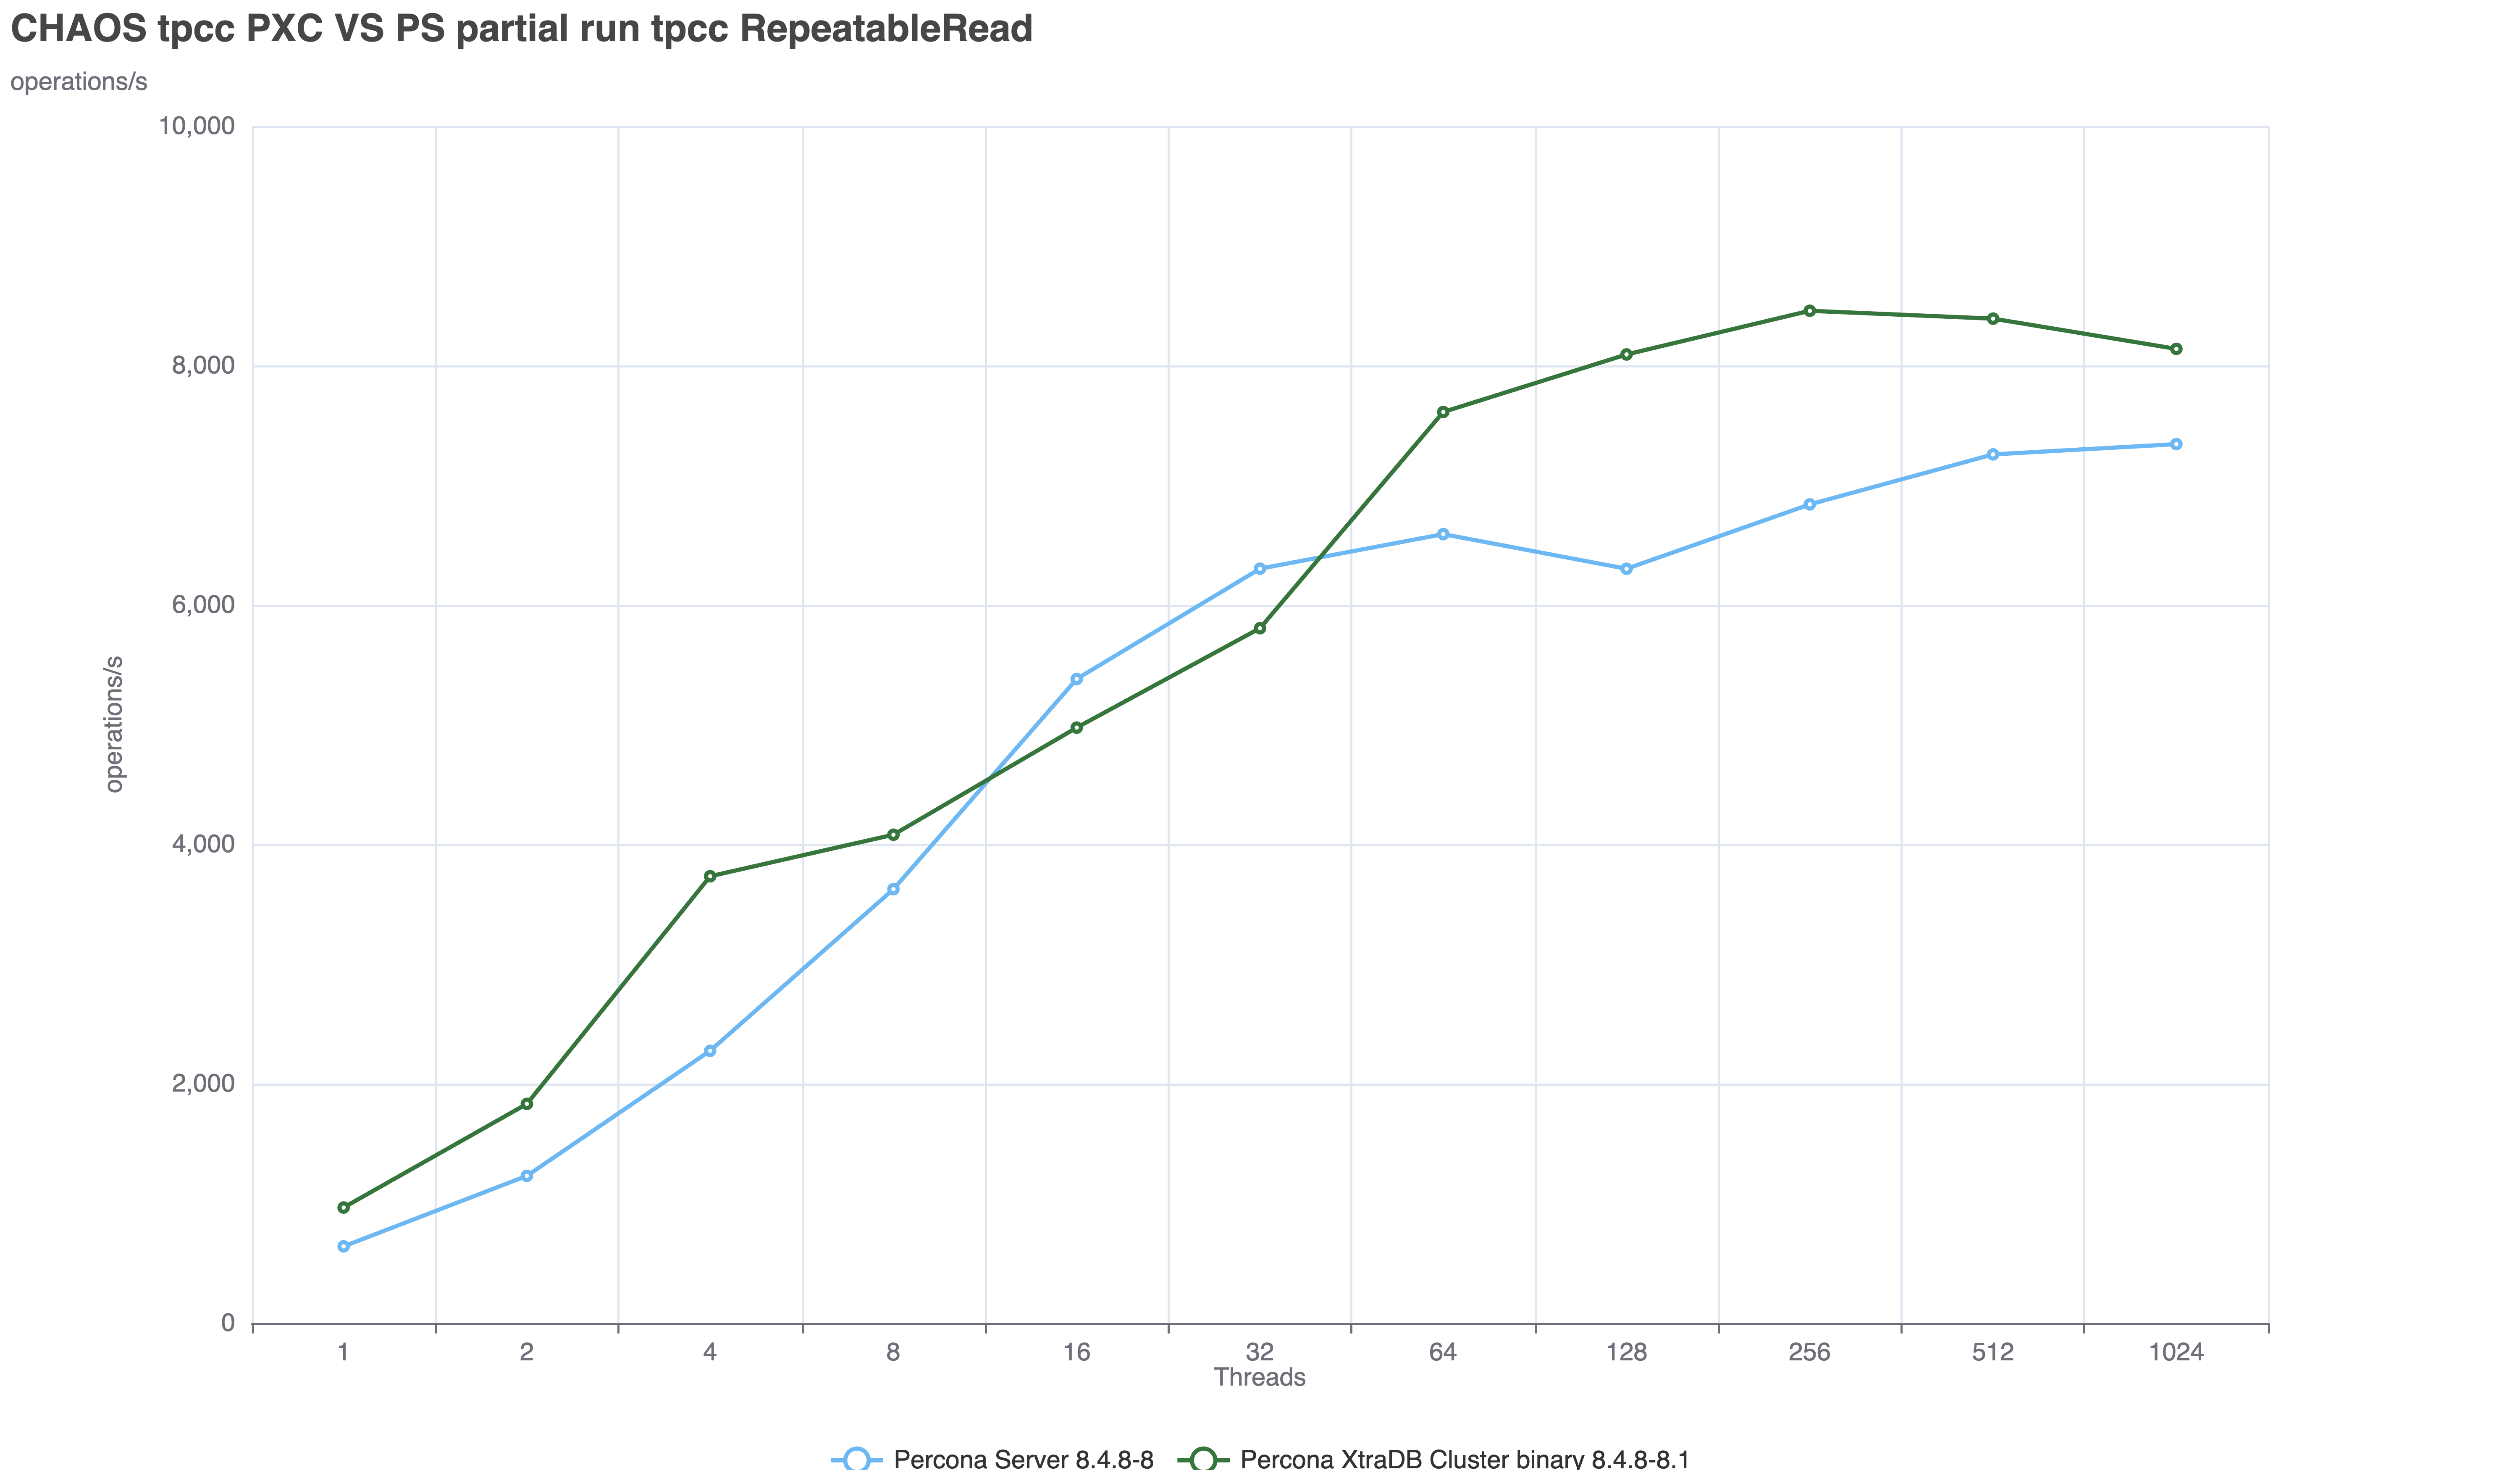
- High concurrency (>128 threads): PXC 8.4 (MySQL 8.4 base) scales better. In Percona's 2026 ecosystem benchmark, MySQL 8.4 and Percona Server 8.4 reached 13,325–13,385 TPS at 512 threads. MariaDB variants peak at 128 threads then show notable degradation.
- Low concurrency / single-thread: MariaDB performs better. MariaDB 10.11 shows excellent single-thread throughput.
- Galera overhead: Write-set certification adds ~2–5% overhead on commit versus standalone MySQL. Identical for both products.
12.2 IST Performance
Percona has demonstrated up to 4x IST improvement in PXC through parallelized write-set application during IST. MariaDB has also improved IST threading but has fewer published benchmarks for direct comparison.
12.3 Large Transaction Performance
Without Streaming Replication, both products behave identically: full write-set certification blocks other nodes during apply. With SR enabled, both achieve similar improvements via Galera 4 library behavior. No meaningful advantage for either product.
13. Key Configuration Differences Summary
| Parameter | PXC 8.x | MariaDB Galera 10.x/11.x |
| wsrep activation | Active when wsrep_provider path set | wsrep_on=ON required explicitly |
| binlog_format | ROW enforced cannot change | ROW recommended; MIXED possible with caveats |
| innodb_autoinc_lock_mode | Must be 2 (pxc_strict_mode enforces) | Defaults to 1 must manually set to 2 |
| SST default method | xtrabackup-v2 | mariabackup |
| Cluster traffic encryption | pxc_encrypt_cluster_traffic=ON (default) | Manual SSL config per subsystem |
| Safety enforcement | pxc_strict_mode=ENFORCING (default) | No equivalent manual discipline required |
| Maintenance drain | pxc_maint_mode=PXCMAINT/MAINTENANCE | Must coordinate externally with load balancer |
| Online DDL (NBO) | Index ops supported open source | Enterprise Server only (not community edition) |
| GTID integration | MySQL GTID native; automatic | wsrep_gtid_mode + wsrep_gtid_domain_id needed |
| IST progress monitoring | wsrep_ist_receive_seqno_* variables | Log file parsing only |
| Monitoring | PMM native + 10 extra wsrep_* status vars | WSREP_INFO plugin; PMM needs extra setup |
| Flow control visibility | wsrep_flow_control_status/interval/interval_low/high | Only basic paused/sent/recv counters |
| IP allowlist for SST/IST | wsrep_allowlist (8.0+) | Not available |
| GCache + Write-Set cache encryption | gcache.encryption and allocator.disk_pages_encryption via wsrep_provider_options; Master Key via ALTER INSTANCE ROTATE GCACHE MASTER KEY; keyring plugin/component required (since 8.0.31-23, tech preview) | Not available |
| FC auto eviction of lagging node | Node self-evicts when FC time exceeds gcs.fc_auto_evict_threshold ratio within gcs.fc_auto_evict_window; older EVS-level evs.auto_evict also available (since 8.0.33-25) | Not available |
14. Decision Guidance
Choose PXC when:
- If you use MySQL Galera and require the shortest possible path to replace it
- Application requires MySQL 8.x-specific features (native JSON binary type, improved window functions, roles, invisible columns)
- You need enforced cluster safety pxc_strict_mode catches dangerous configurations before they diverge data
- Simplest possible encryption setup is required (pxc_encrypt_cluster_traffic=ON)
- Using PMM for monitoring and want native Galera dashboards out of the box
- You need NBO (online DDL for indexes) without an enterprise license
- Already using Percona XtraBackup for backups SST toolchain is shared
- DR replication topology connects to MySQL 8.x replicas (GTID-compatible)
- High concurrency (>128 threads) write workloads where MySQL 8.x scales better
Choose MariaDB Galera when:
- Application relies on MariaDB-specific features: temporal tables, Sequences, Spider, Aria, MariaDB stored procedure syntax differences
- Async replication to MariaDB-native replicas using GTID is required
- Team DBA expertise is MariaDB-centric
- Low-concurrency workloads where MariaDB single-thread performance is superior
- WSREP_INFO plugin’s information_schema tables are useful to your monitoring tooling
Migrating between the two:
- Full logical migration only, no physical data directory copy is possible
- Use mysqldump or mydumper; expect schema adjustments for JSON columns, auth plugins, and reserved words
- Reconfigure entire GTID replication topology
- Allow significant application testing time SQL mode, optimizer, and implicit conversion differences will surface
- Test pxc_strict_mode=ENFORCING carefully existing MariaDB schemas often have tables without PKs or MyISAM tables that will block startup