Some time ago, I published the article “AWS Aurora Benchmarking - Blast or Splash?”. In which I was analyzing the behavior of different solutions using synchronous replication in AWS environment.
After I published it, I received a lot of comments and feedback, from the community and from Amazon engineers.
Given that I had decide to perform another round of tests, keeping into account the comments received and the suggestions.
I had presented some of the results during the Percona conference in Santa Clara last April 2016. The following is the transposition into an article of that presentation with more details.
{autotoc enabled=yes}
Why new test?
Very good question, with an easy answer.
Aurora is a product that is still under development and code refining, six months of development could present major changes in performance. Not only, the initial tests where focus on entry level solutions, meaning I was analyzing that kind of user, that are currently starting their business and looking for a flexible solution allow them to save money and scale.
This time I had put the focus on enterprise solution, analyzing what an already well establish company would eventually get when in the need to find for a decent scalable solution.
As such two different scenarios.
Why so many (different) tests?
I had used many different benchmarking tool, and I am still planning to run others. Why so? Why don’t simply relay in one of them?
Again simple answer, I had use different tools because in some case they provide me different way of access and use data. Not only, I do not trust benchmarking tools, not even the one I had developed, as such I want to tests same thing using different tools and compare results, ONLY if I see a common pattern, then I consider the test valid. Personally I tend to discard any test is not consistent or analysis performed using a single benchmarking tool. In my opinion be lazy is not an option when doing this kind of exercises.
Tests run
I had run three main kind of tests:
-
Performance and load stress
-
High Availability failover
-
Response time (latency) from application point of view
Performance and load stress
These tests were the most extensive and demanding.
I was analyzing the capacity to serve load in different conditions, from light load up to full utilization and some degree of saturation or resources.
First set of tests was to evaluate simple load on a single table causing the table to become a hotspot and showing how the platform would manage the increasing contention.
Second set of tests was to perform similar load but distributing it cross multiple table and batching the operations. Parallelization, contention, scalability and distributed hotspots where in the picture.
The two above were focus on write operation only, and were done using different tools comparing the results given they were complementary.
Third set of tests, using my own stresstool, was focus on R/W oriented usage. Performed tests execute against multiple tables, performing CRUD actions, using simple and batch insert, reads by PK, index, by range, IN and exact match conditions.
Fourth set of tests was performed using TPC-C like load (OLTP).
Fifth set of tests was using Sysbench in OLTP mode with 250 tables.
Scope of the last three set of tests was to identify how the platforms would had managed the load, considering the following:
-
Read and write contention on the same tables
-
High level of parallelism (from the application)
-
Possible hot-spots (TPCC district)
-
Increasing utilization (memory, threads, IO)
-
Saturation (connections)
Finally, all tests were run with fully utilized BufferPool.
About the tests
It was difficult to compare apple with apple here. And I think that is the main point to keep in mind.
Aurora is not a standard RDS solution, as we were used to have.
Aurora looks like MySQL, smell like MySQL, but is not vanilla MySQL.
To achieve what they have to achieve the engineers there had to change many parts, and the more you dig the more you realize there are significant differences.
Because that I had to focus more on identify what each solution can do, comparing solutions against expectations, instead comparing the numbers for the numbers.
I was more interested to see, what happen if I have a burst of connections and my application will go from 4K to 40K connections. Will it crash? Will it slow down?
How long I should wait if a node fails?
What should I prevent to have in my schema design, in order to do not have bottlenecks.
In this context, those in my opinion, are relevant questions, more than discover that solution A can have 3000 rows written/sec and the other can have 3100.
Or that I may (may) have some additional page rotation, file -> memory-> flush because the amount of memory differs.
Those are valuable information too, for sure, but less than have a decent understanding of which platform will help my business to grow and remain stable.
What is the right tool for the Job? This is the question I was addressing.
The machines
Small Boxes (first round of tests)
EIP = 1
VPC = 1
ELB=1
Subnets = 4 (1 public, 3 private)
HAProxy = 6
MHA Monitor (micro ec2) = 1
NAT Instance (EC2) =1 (hosting EIP)
DB Instances (EC2) = 3 (m4.xlarge) 16GB
Application Instances (EC2) = 6 (4)
EBS SSD 3000 PIOS
Aurora RDS node = 3 (db.r3.xlarge) 30GB
Large Boxes (latest tests)
EIP = 1
VPC = 1
ELB=1
Subnets = 4 (1 public, 3 private)
HAProxy = 4
MHA Monitor (micro ec2) = 1
NAT Instance (EC2) =1 (hosting EIP)
DB Instances (EC2) = 3 (c3.8xlarge) 60GB
Application Instances (EC2) = 4
EBS SSD 5000 PIOS
Aurora RDS node = 3 (db.r3.8xlarge) 244GB
Note
It was pointed to me that I had deliberately choose to use an Ec2 solutions for PXC with less memory than the one available in Aurora.
This is true, and we must keep in to consideration.
Reason for this is the fact that the only Ec2 solution matching the memory of a db_r3.8xlarge is the d2.8xlarge.
I did try it but the level of scalability I got from the CPU point of view was less efficient than the one available with c3.8xlarge.
Given that I had decide to prefer CPU resource to memory here, especially because I was going to test, concurrency and parallelism in conjunction to load increase.
From the result I got I feel confident that I choose right, but I am open to comment.
The layout
This is how the setup looks like
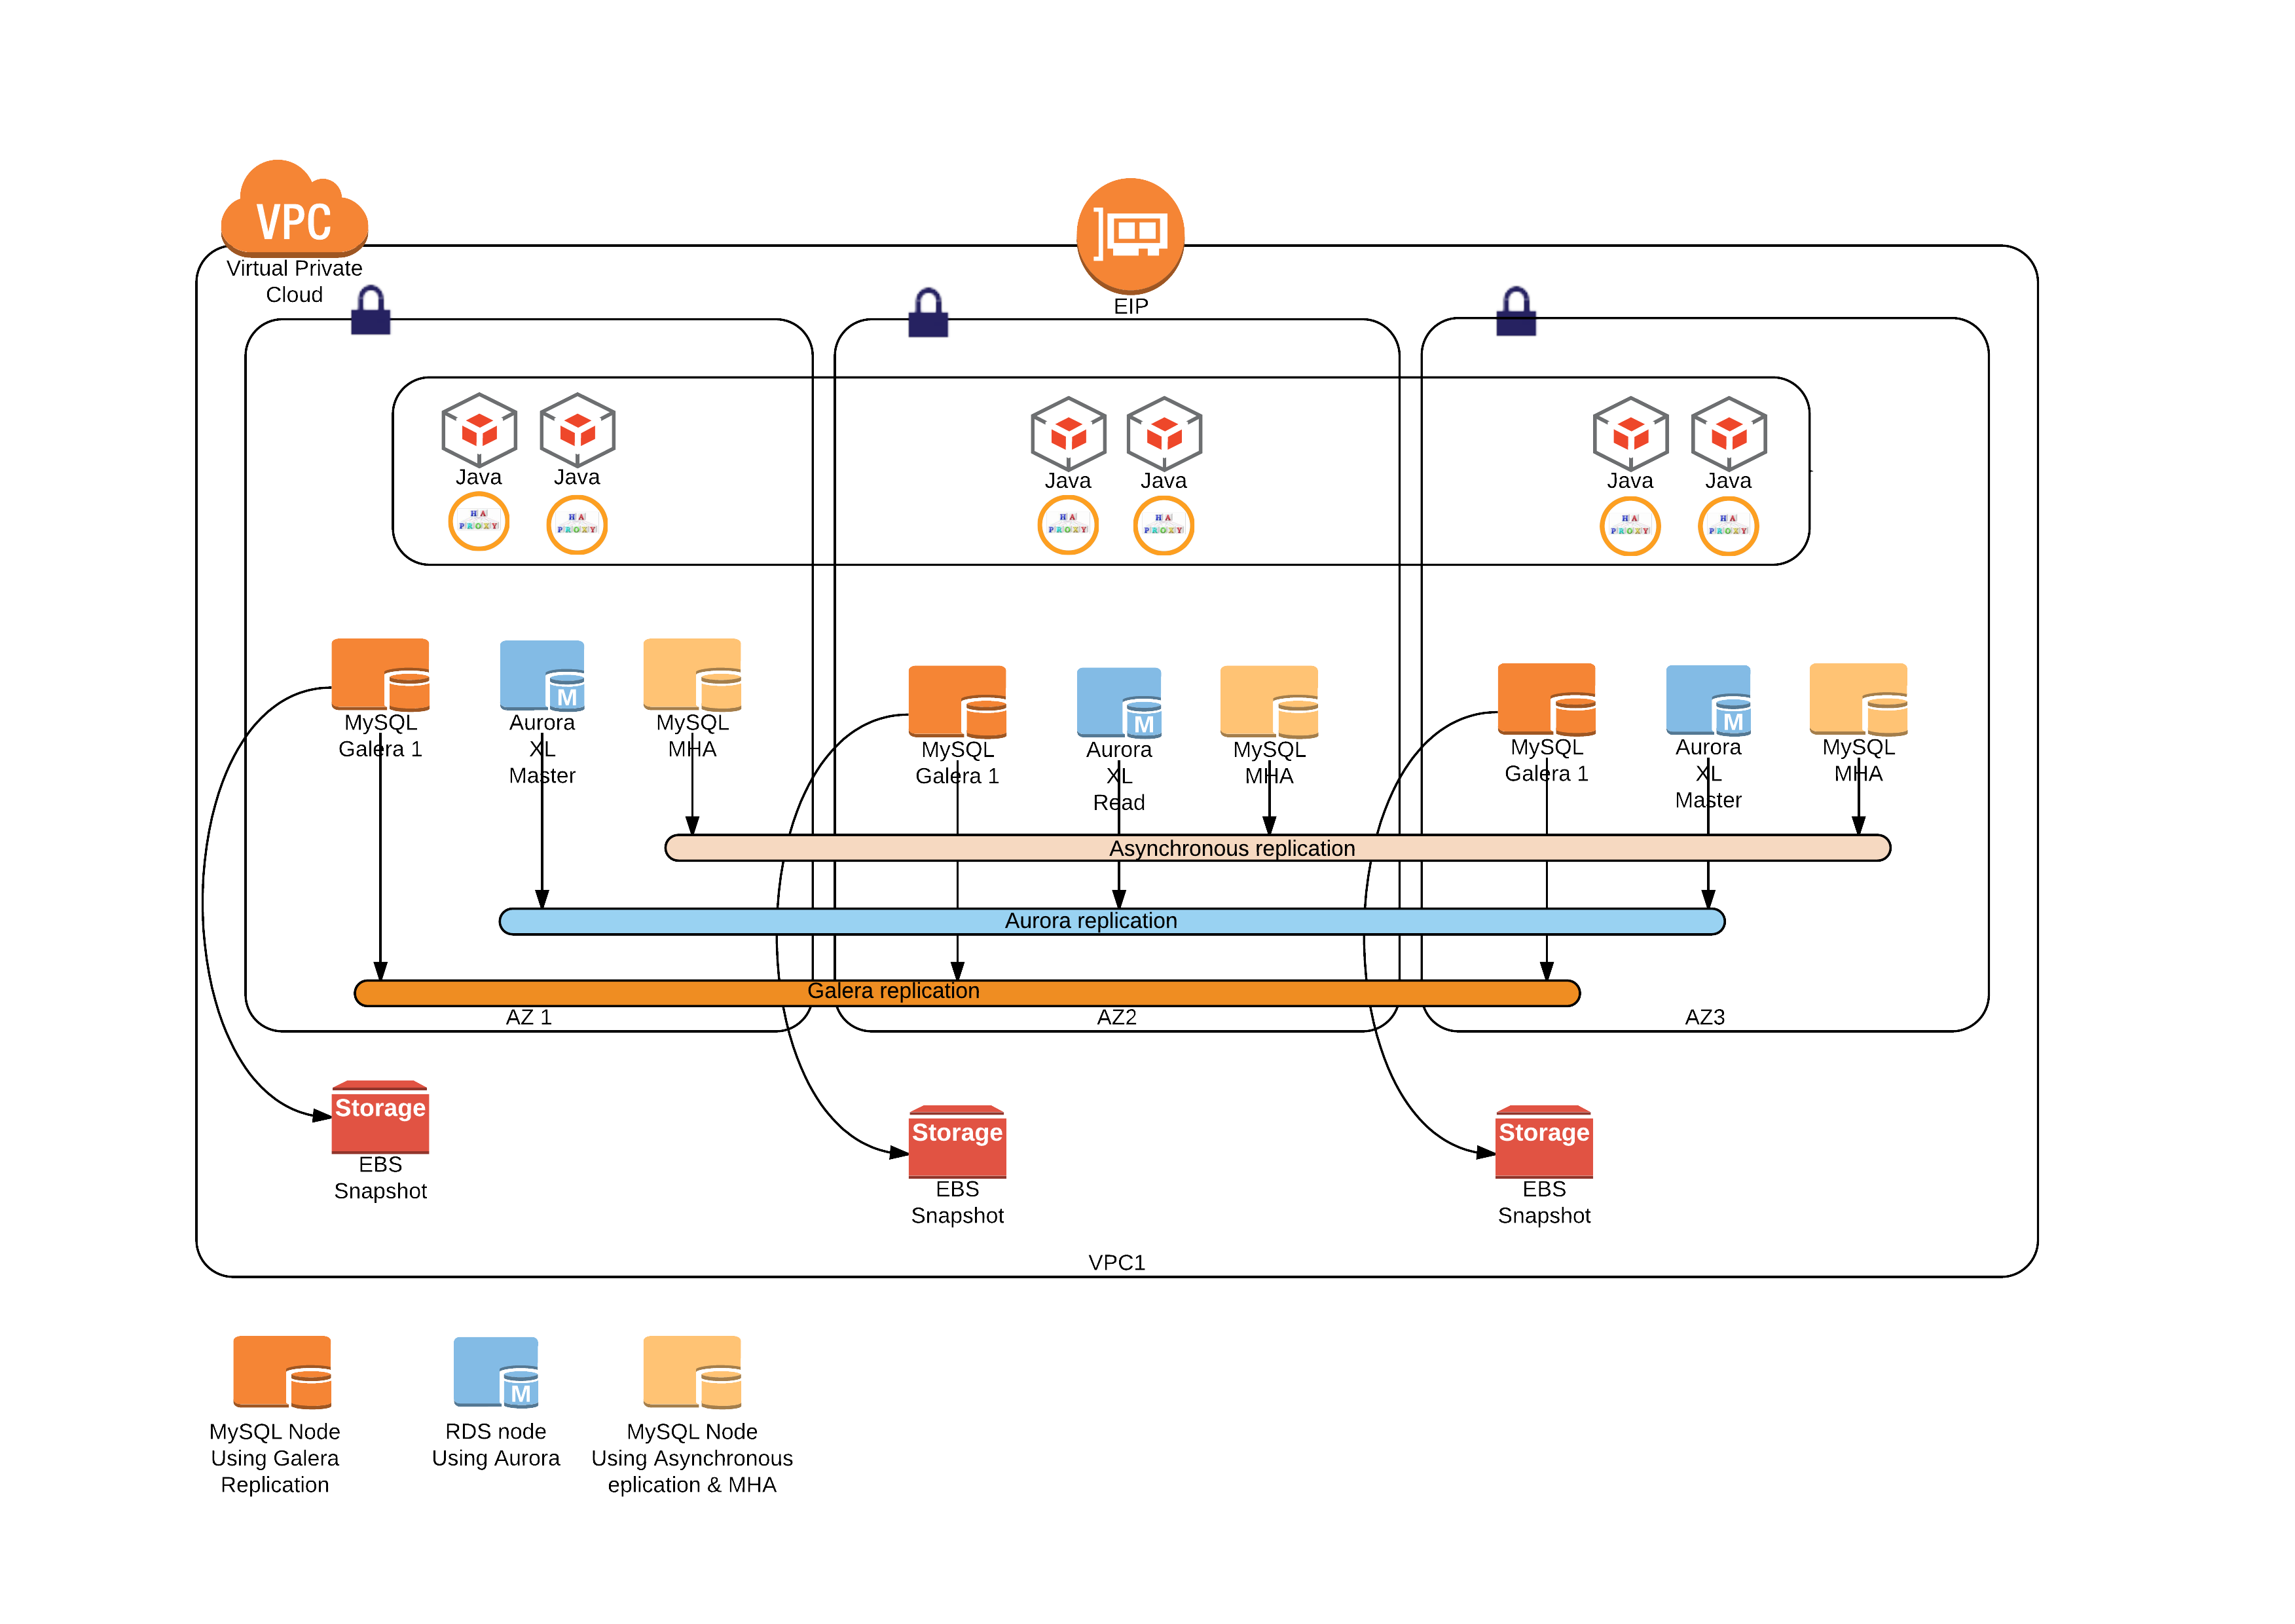
Where you read Java, those are the application nodes running the different test applications.
Two words about Aurora first
Aurora has few key concepts that must have clear in mind. Especially how it manages the writes cross replica, and how connections are implemented.
The IO activity
To replicate the information across the different storage, Aurora replicate FRM files and data coming from IB_LOGS only. This is a quite significant advantage to other form of replication, given the limited number of bytes that are replicated over the network also if they are replicated for 6 times.
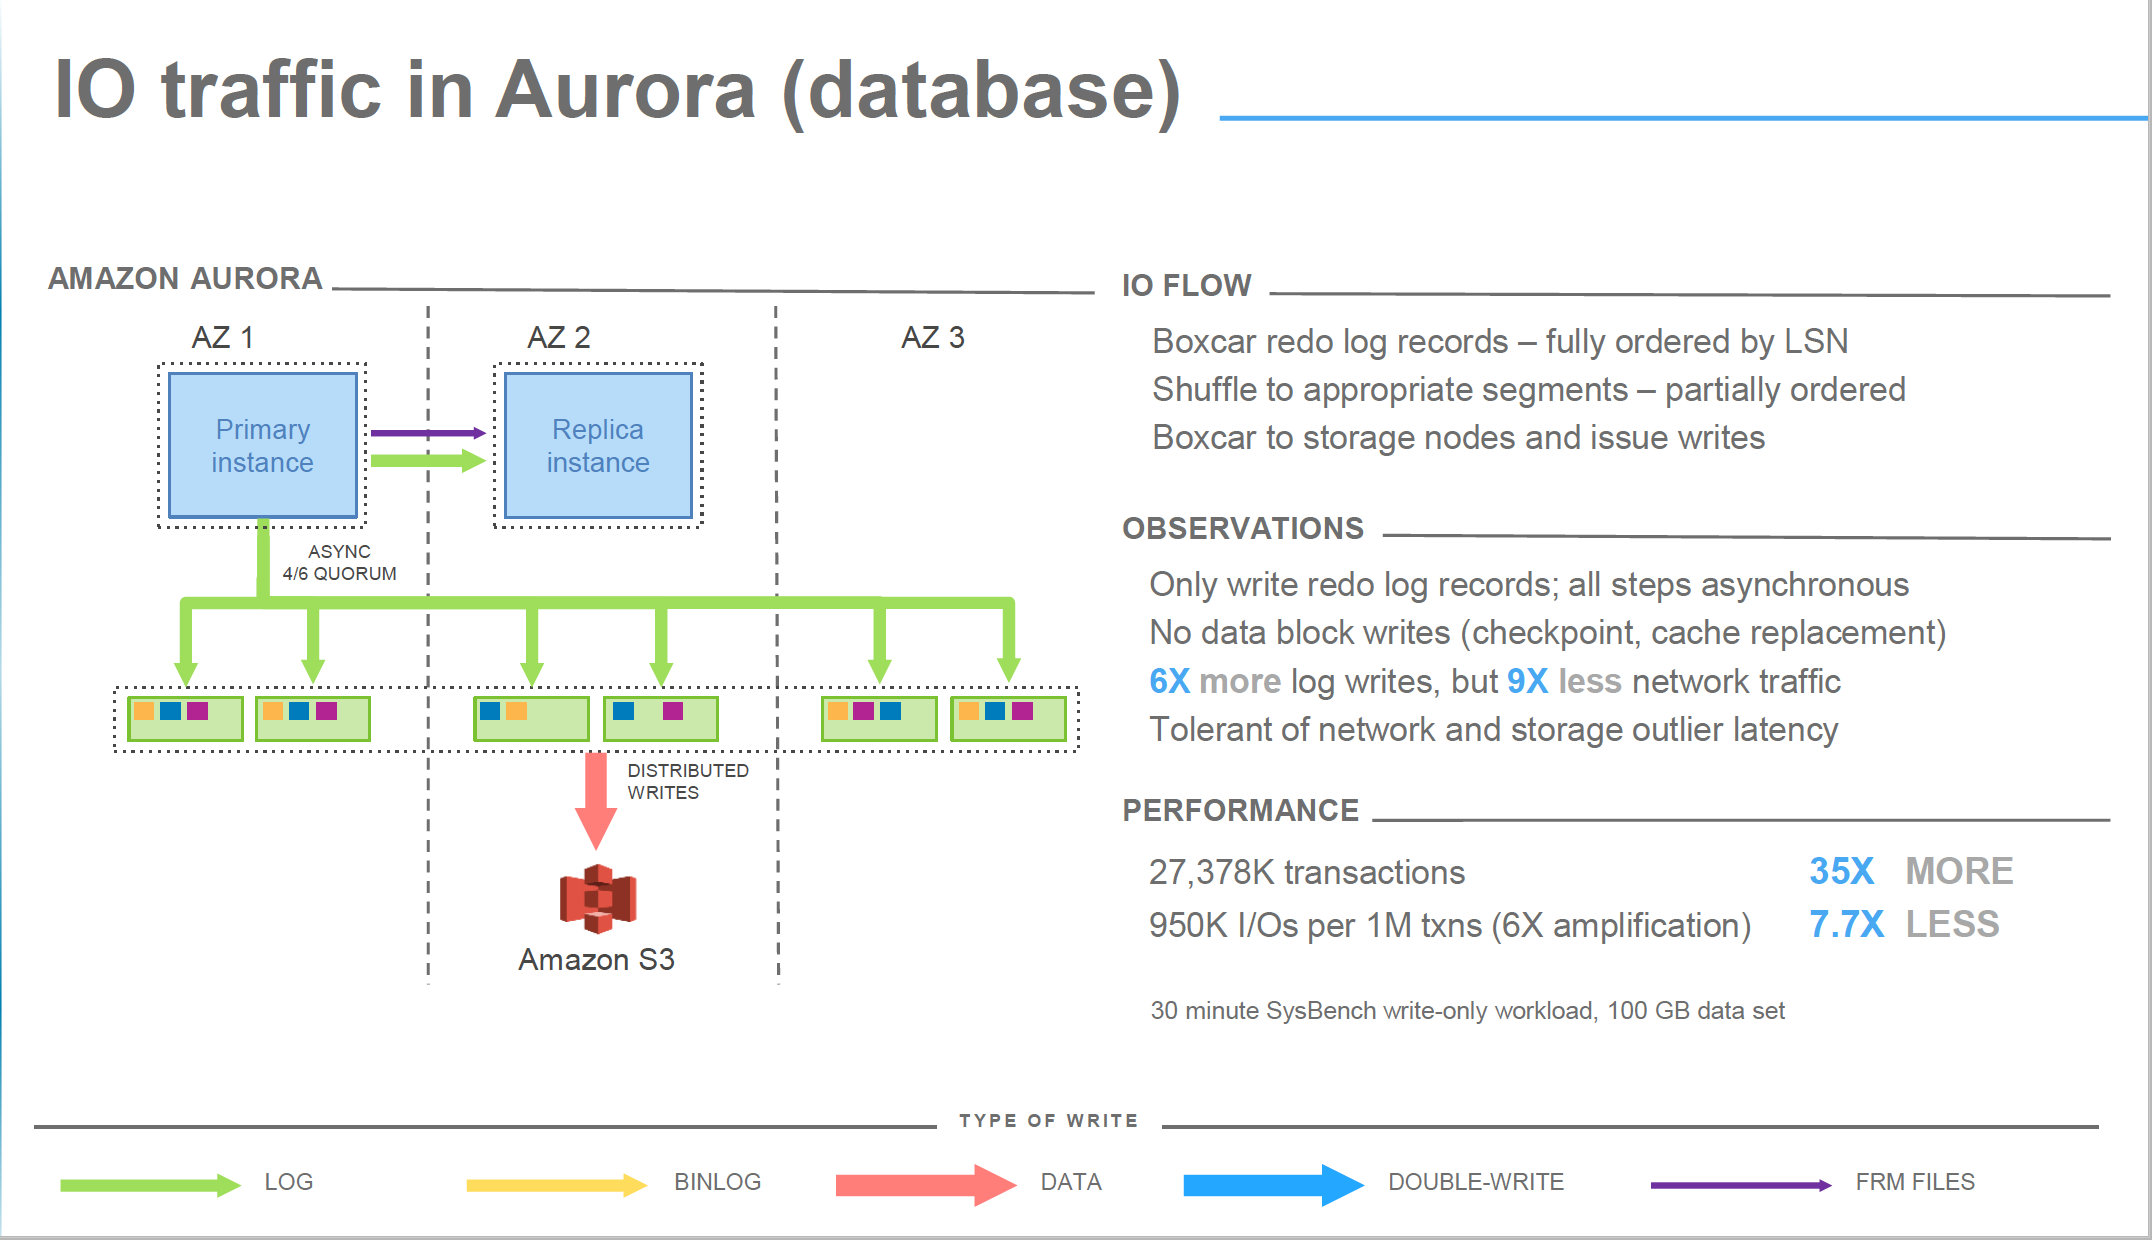
image from Amazon Aurora Deep dive
Another significant advantage is that Aurora does not use double write buffer which is obviously another blast (see recent optimization in Percona Server https://www.percona.com/blog/2016/05/09/percona-server-5-7-parallel-doublewrite/ ) .
Simplifying, writes in Aurora are organized filling its commit queue and pushing the changes as group commit to the storage.
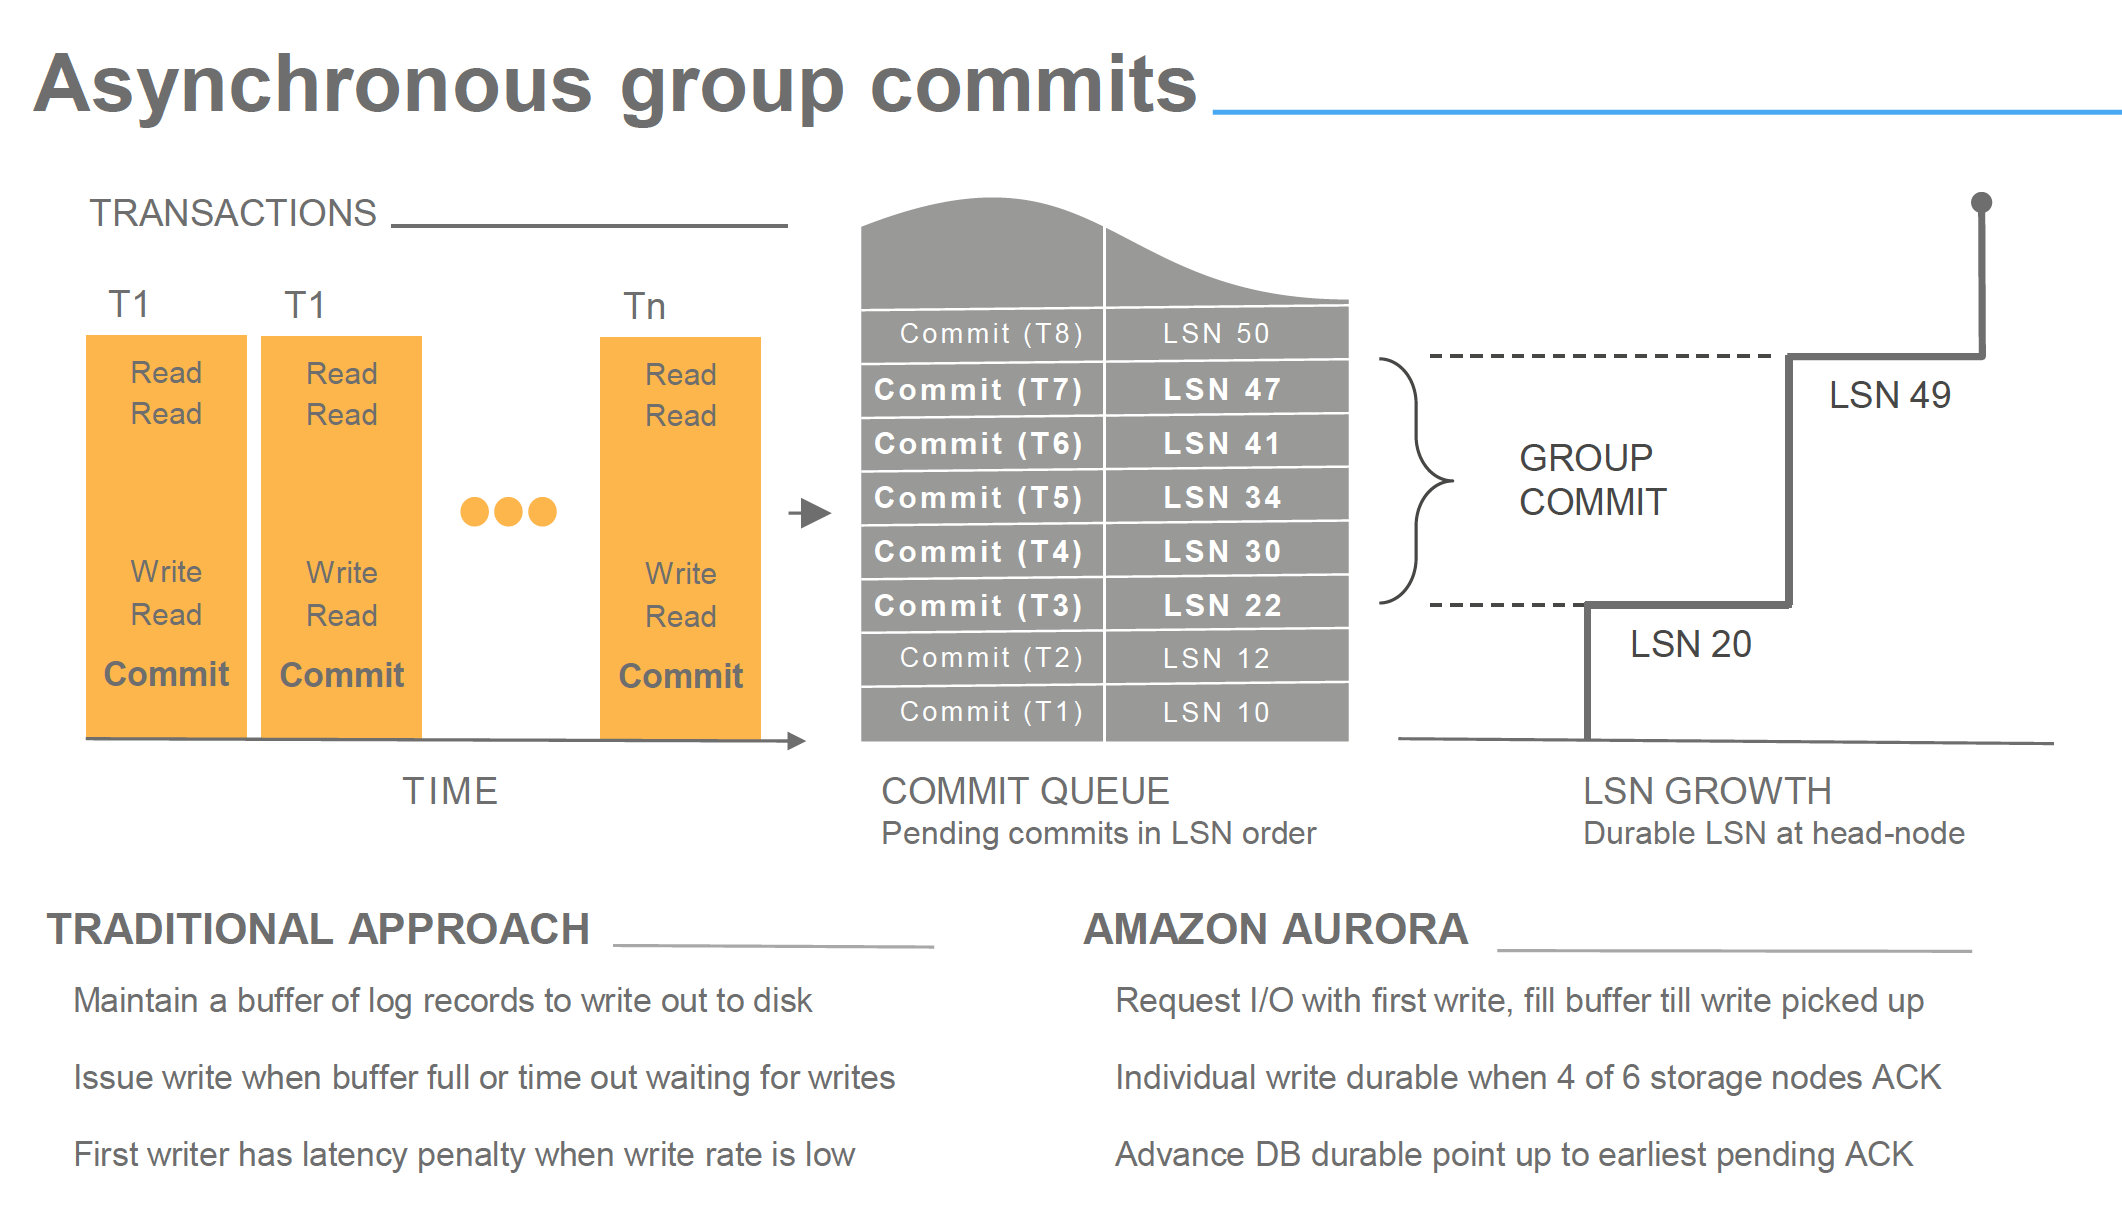
image from Amazon Aurora Deep dive
Now in some presentations you may have seen that all steps are asynchronous, but is important to underline that a commit is acknowledge by Aurora when at least 2 AZ had received and wrote the incoming data related to that commit. Writes here means received in the storage node incoming queue, and with a quorum of 4 over 6 nodes.
This means that no matter what, data has to travel on the network reach the final destination and ack signal come back, before Aurora returns the ack to the commit operation. Network is in the same region but still it could represent an incognita about performance. No wonder if we may have some latency at this stage.
As you can see what I am reporting is also confirmed in the image below and in the observations, point is that from that slide is not clear the impact of the step 1 – 2.
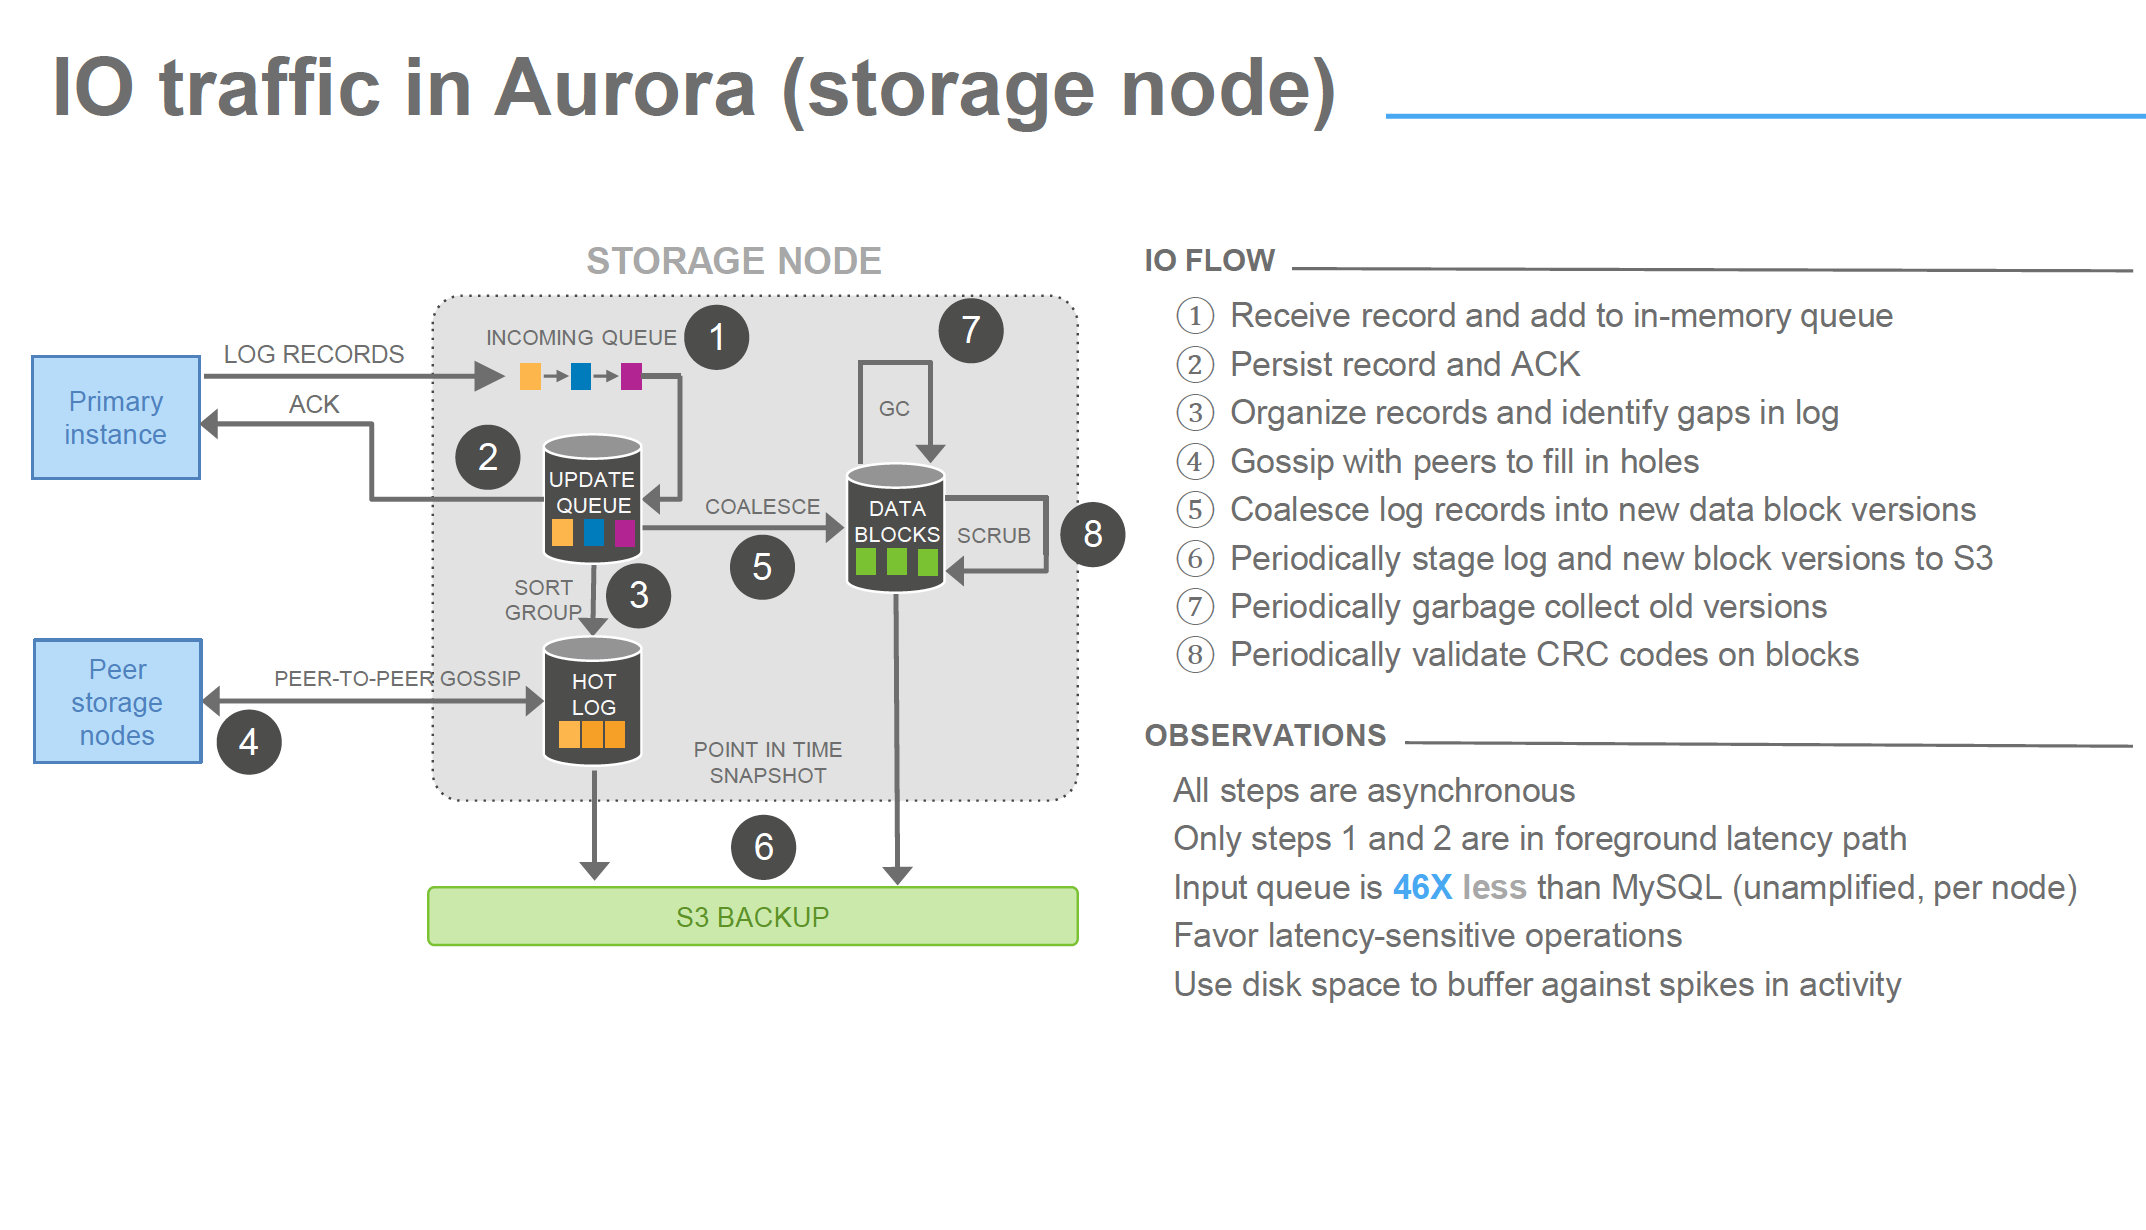
image from Amazon Aurora Deep dive
Thread pooling
Oh yes, Aurora use thread pooling, a lot. That will become very clear later, and more the work is based on parallelism, more efficient thread pooling seems to be.
In most cases we are used to see CPUs on database servers not fully utilized, unless some heavy ordering operation or bad query. That behavior is also (not only) a direct consequence of the connection-to-thread model, that imply period of latency and stand by. In Aurora the incoming connections are not following the same model, instead the pool redistributes the load of the incoming connection to a pool of threads, optimizing the latency period, resulting in a higher CPU utilization. Which is what you want from your resource, to be utilized and not sit there waiting for something else to do its job.
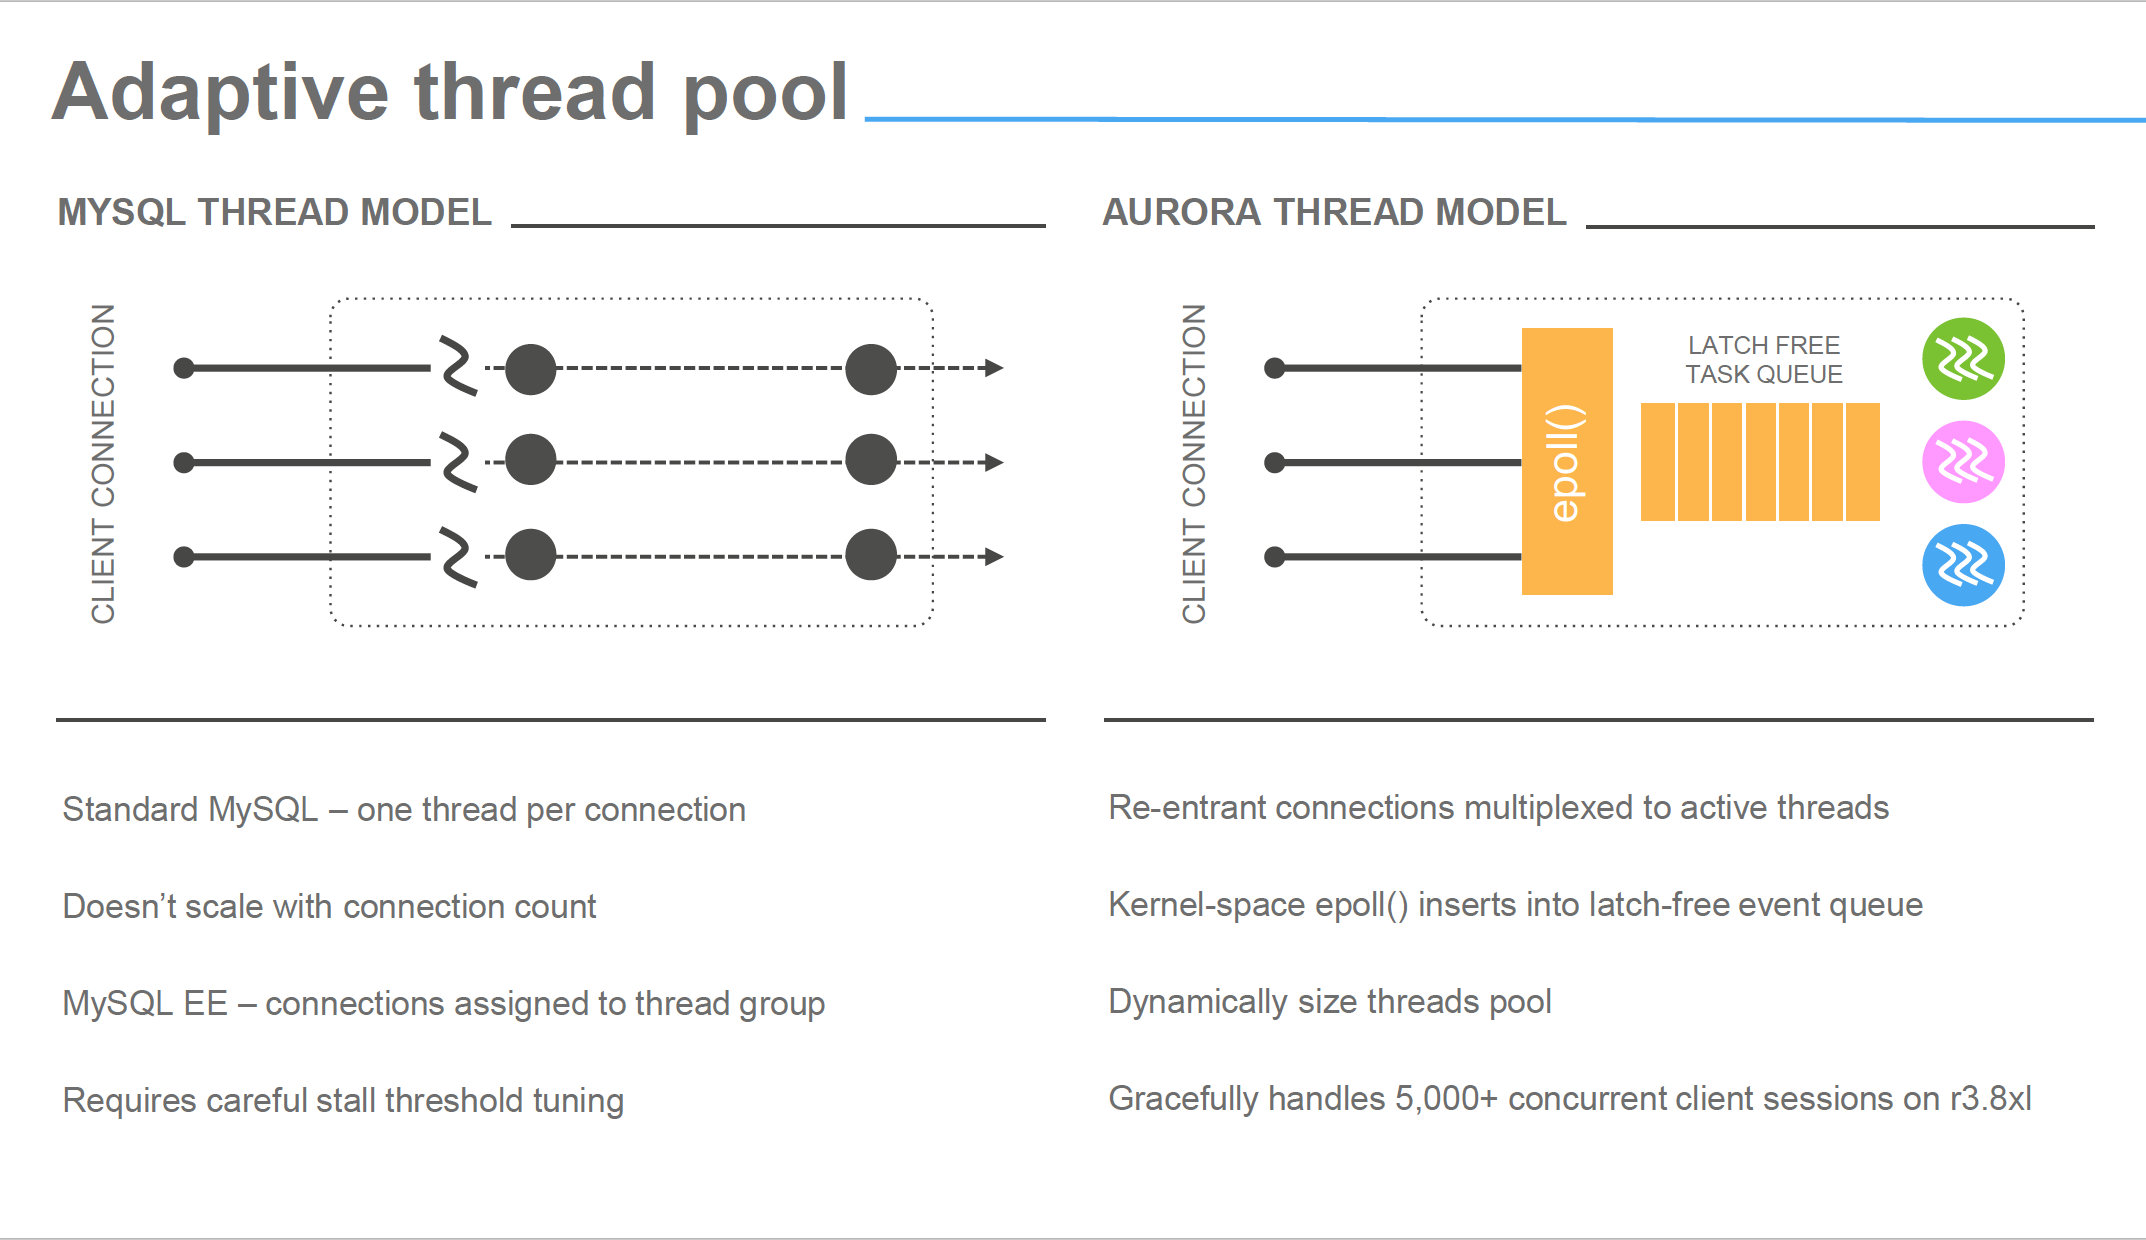
image from Amazon Aurora Deep dive
The results
Without additional waste of electronic ink, let see what comes out by this round of tests (not the final one by the way). To simplify the reading, I will report also the graphs from the first set of tests, but will focus on the latest, Small Boxes = SB, Large Boxes LB.
First test: IIBench
As declared previously my scope was to verify how the two platforms would have reacted to simple load focus on insert on a basic single table, bufferpool was saturated before the running.
SB
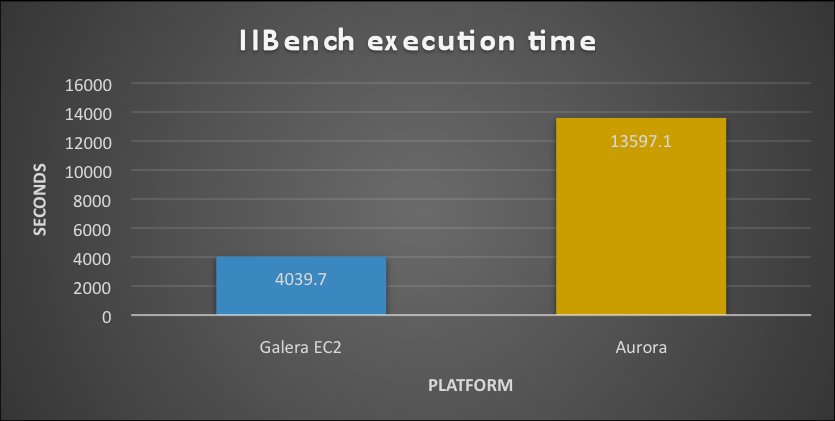
LB
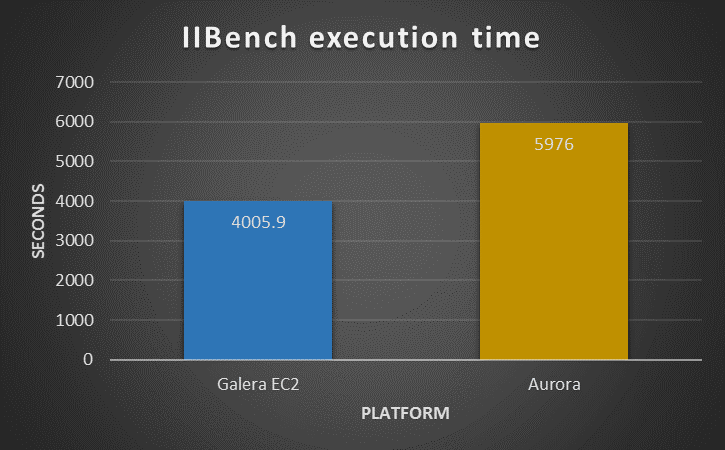
As we can see in presence of a hot spot the Solution using PXC outperform the Aurora, in both cases. What is notable though is that while PXC remain approximately around the same time/performance, Aurora is significantly reducing the time taken. This shows that Aurora was actually taking advantage of the more powerful platform while PXC was not able to.
Analyzing in more details what was happening, we can notice that Aurora is actually performing atomically better. It was able to manage more writes/second as well as rows and page managed. But it was inconsistent, Aurora was having performance hiccups at regular intervals. As such the final result was that it takes more time to process the whole workload.
I was not able to dig a lot given some metrics are not fully available in Aurora, as such I had to fully rely on Aurora engineers who mention me the hot-spot contention as possible issue.
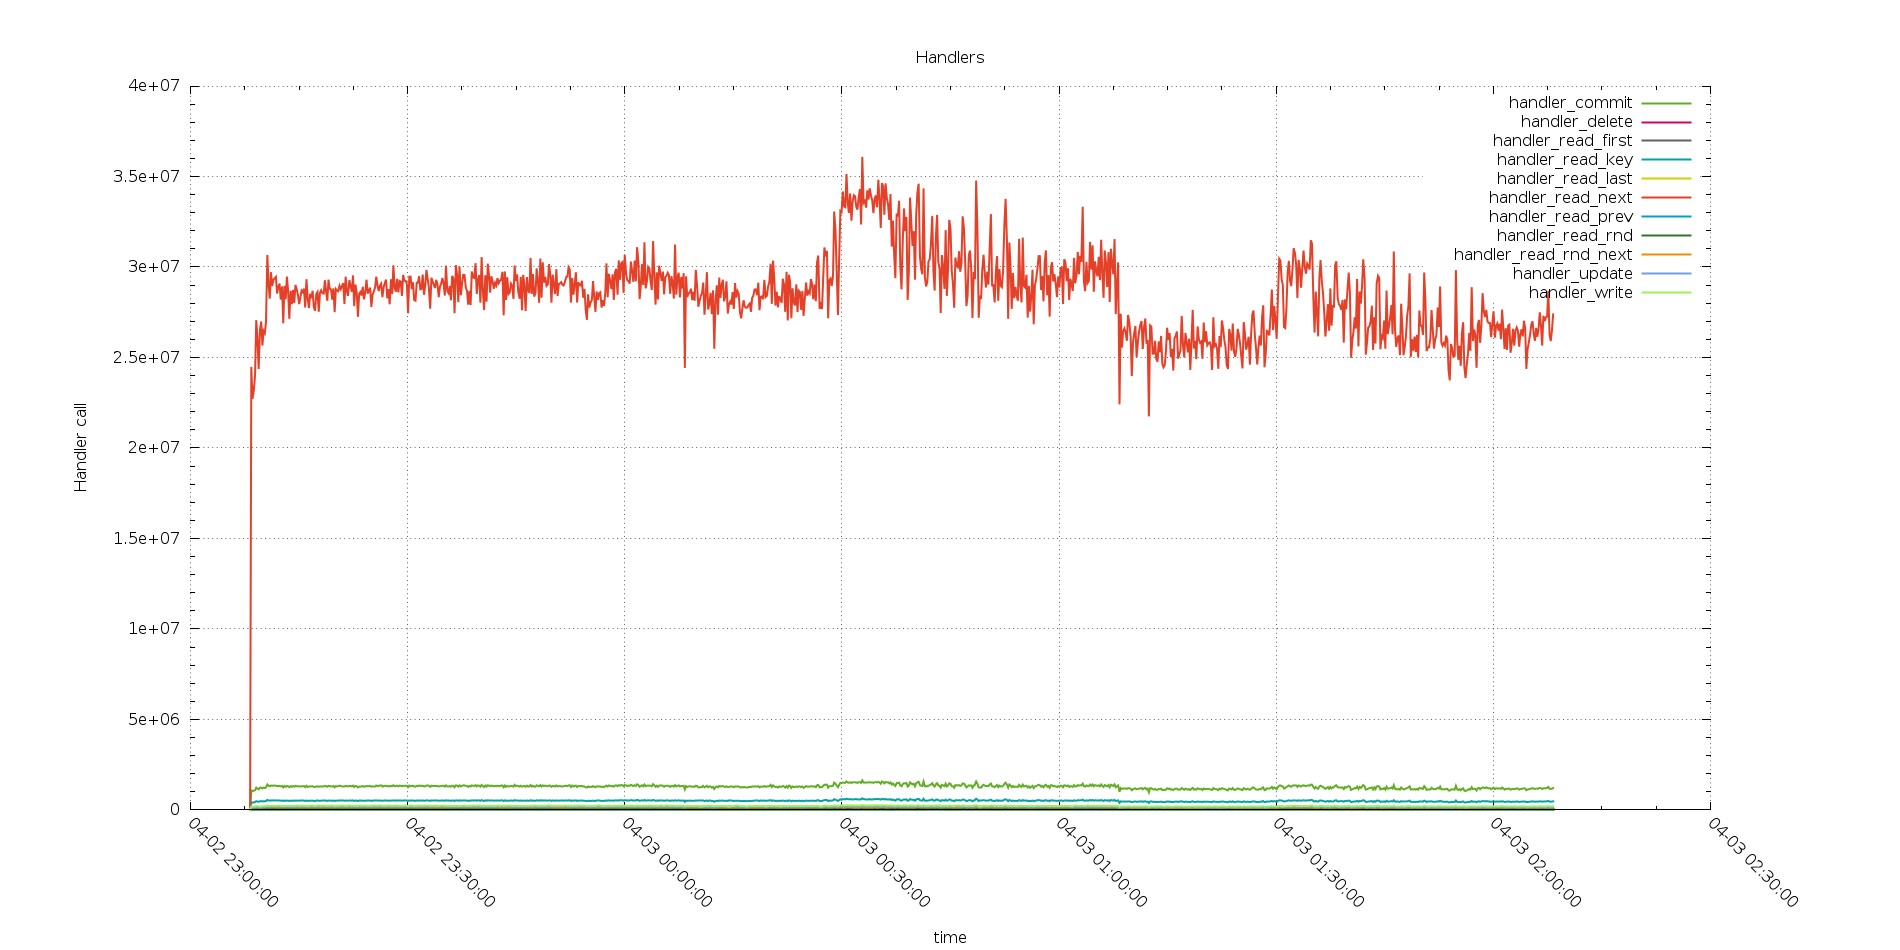
Aurora Handler calls
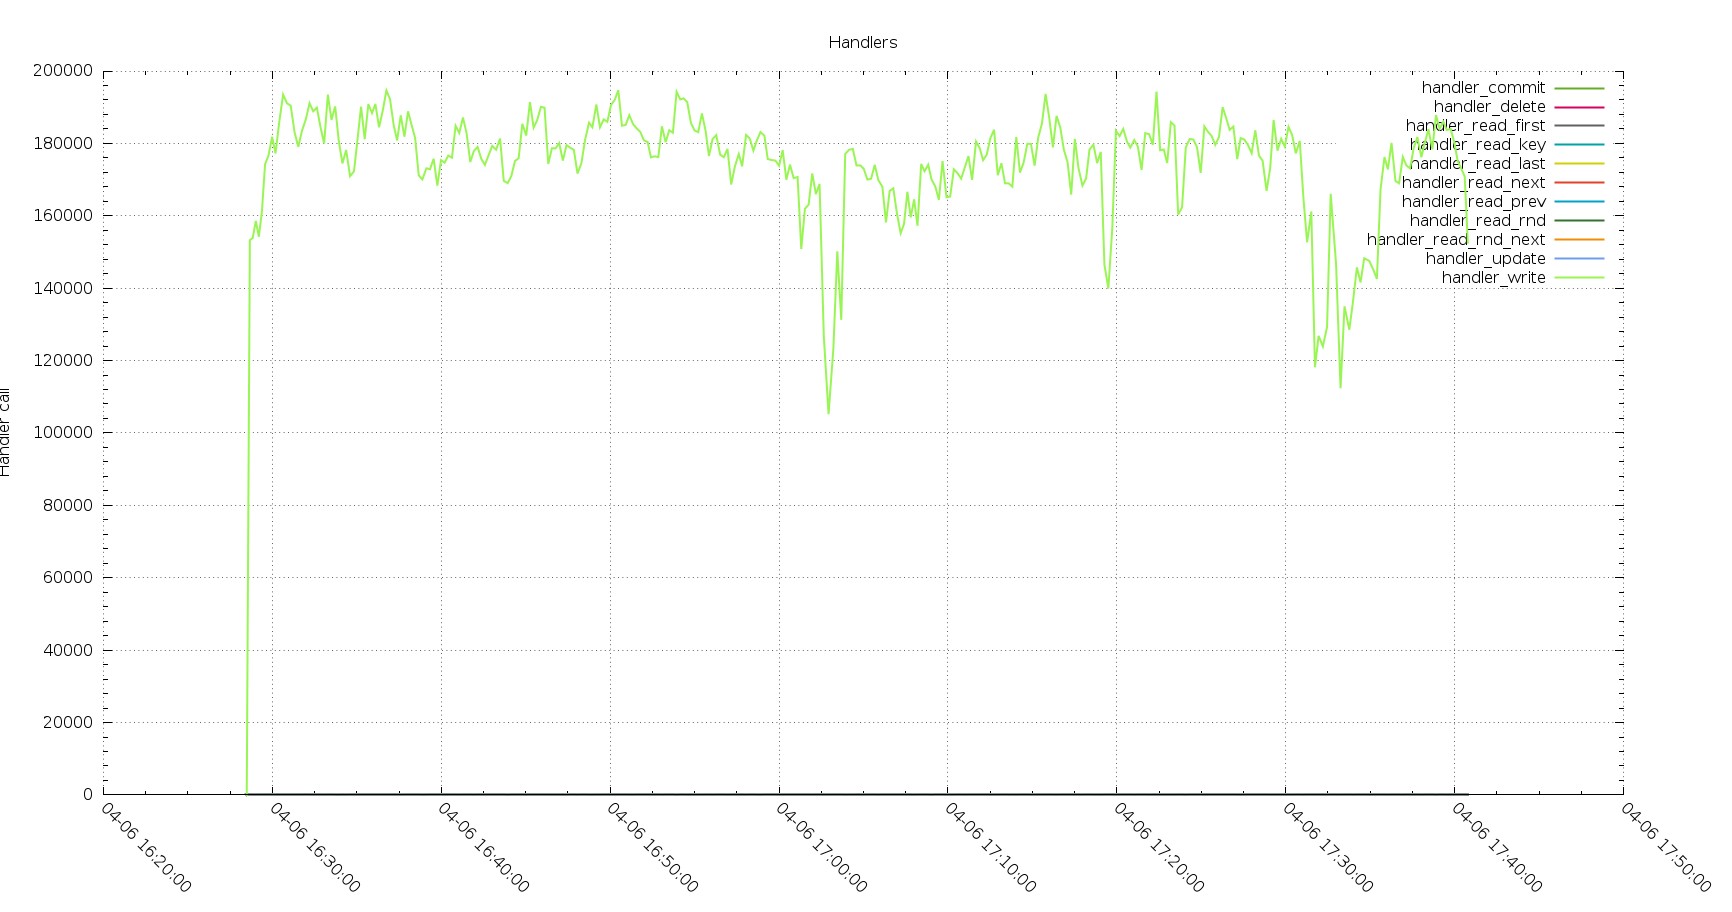
PXC Handlers calls
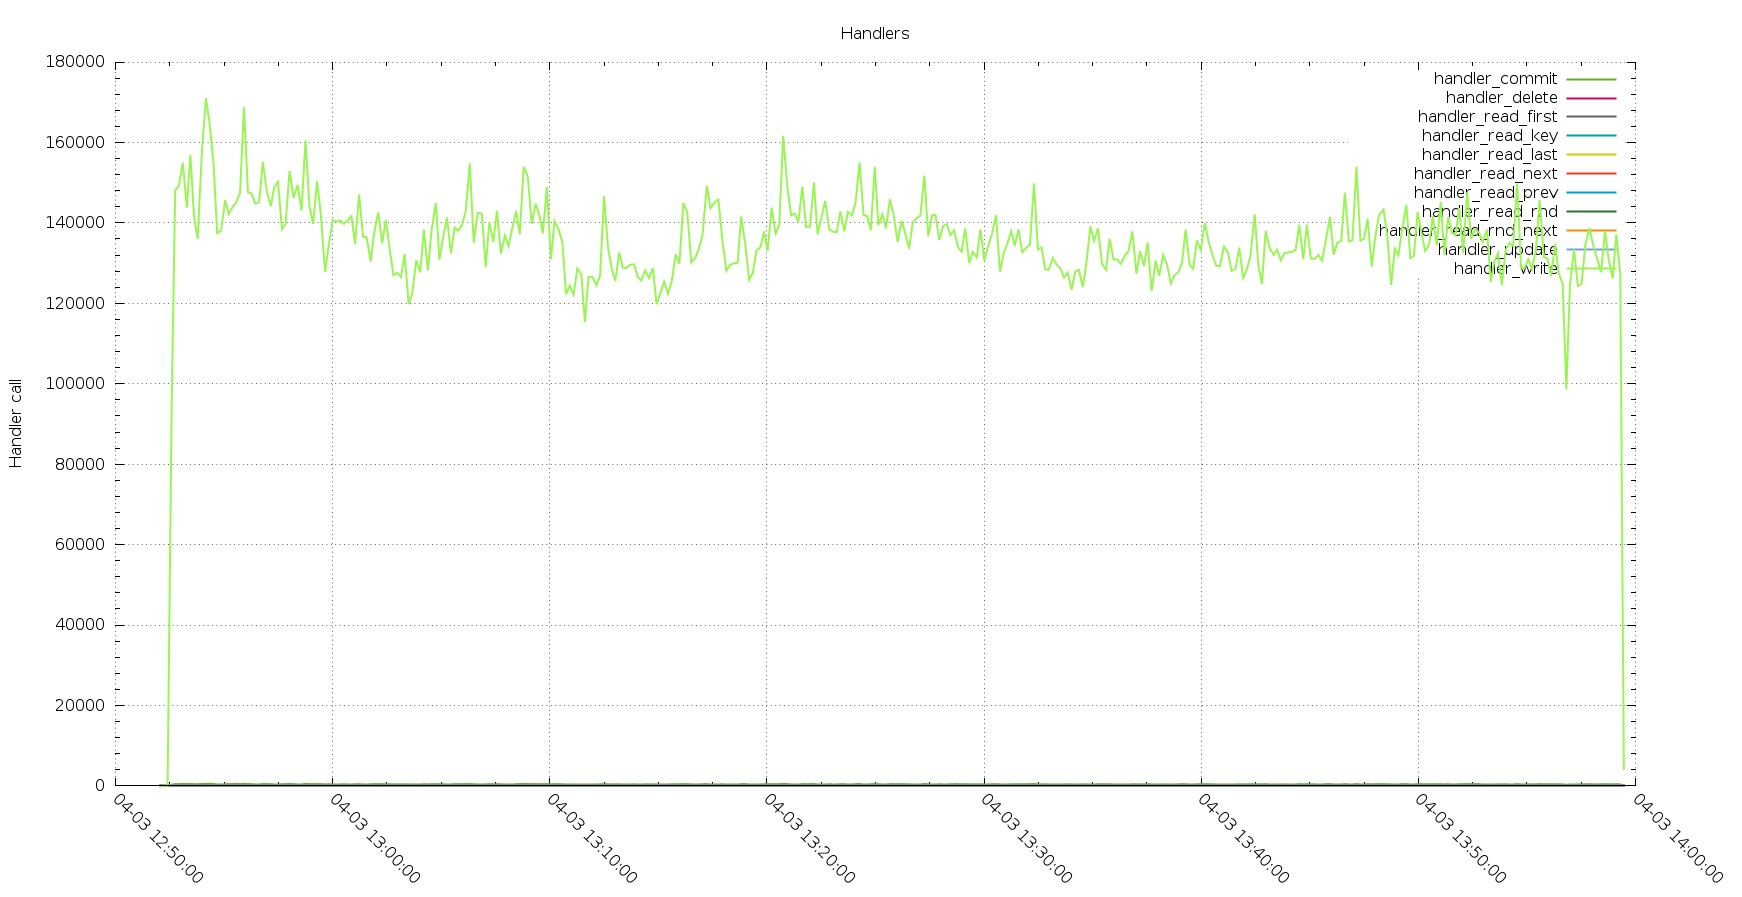
The execution in PXC is showing less calls but constant performance, while Aurora has hiccups.
Aurora Page Activity Write
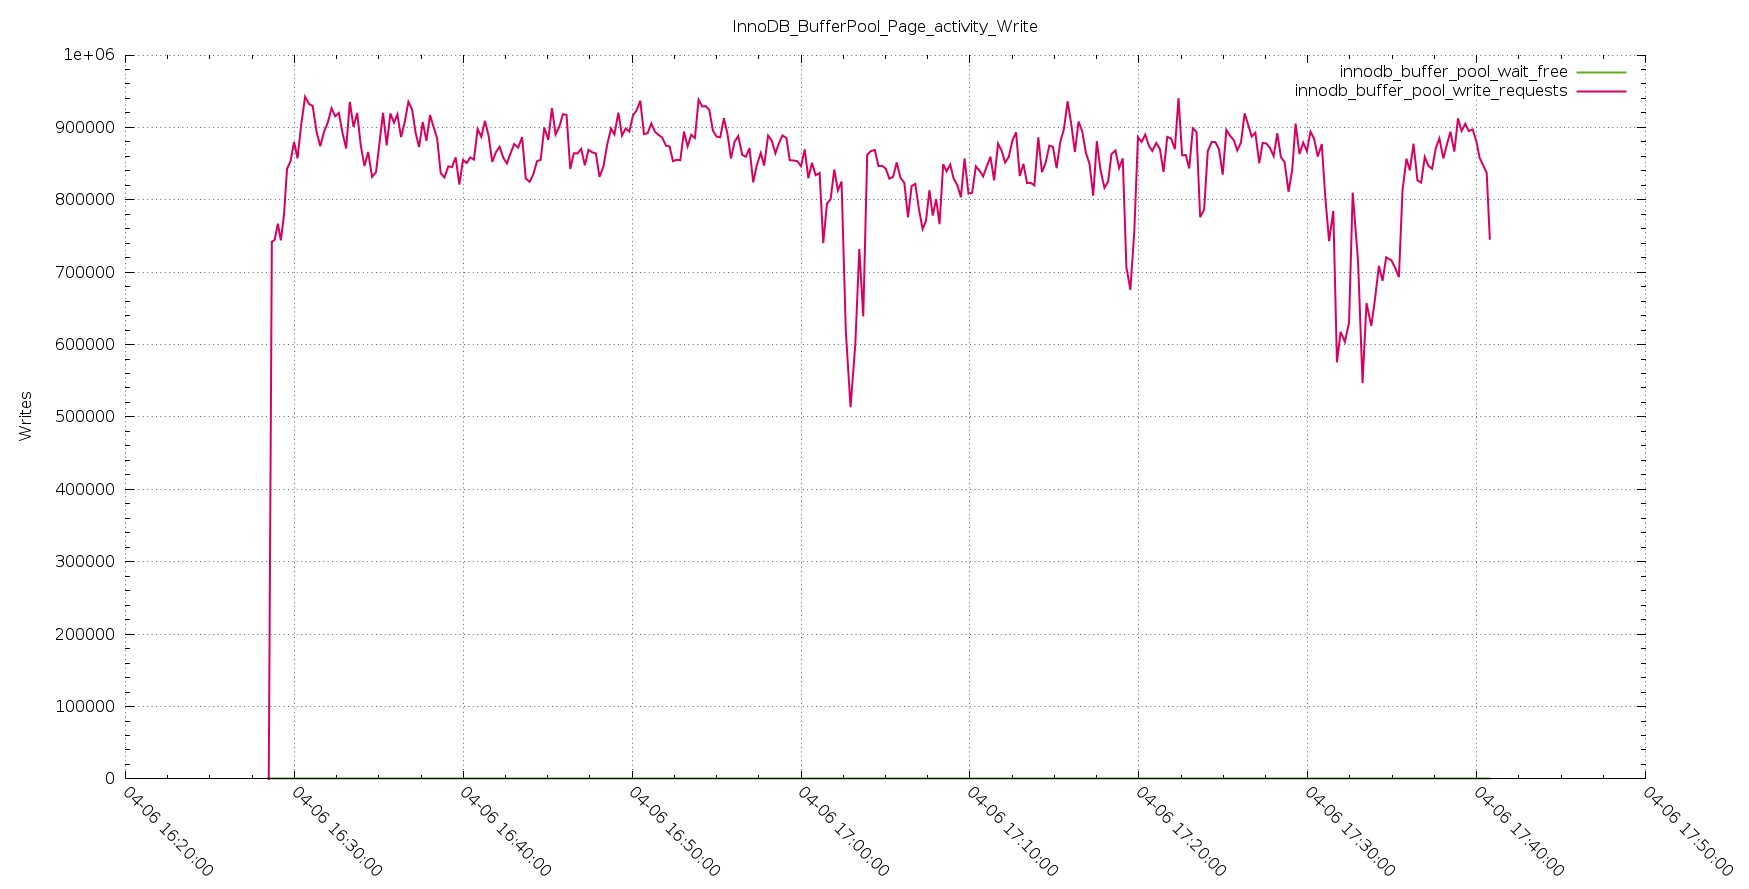
PXC Page Activity Write
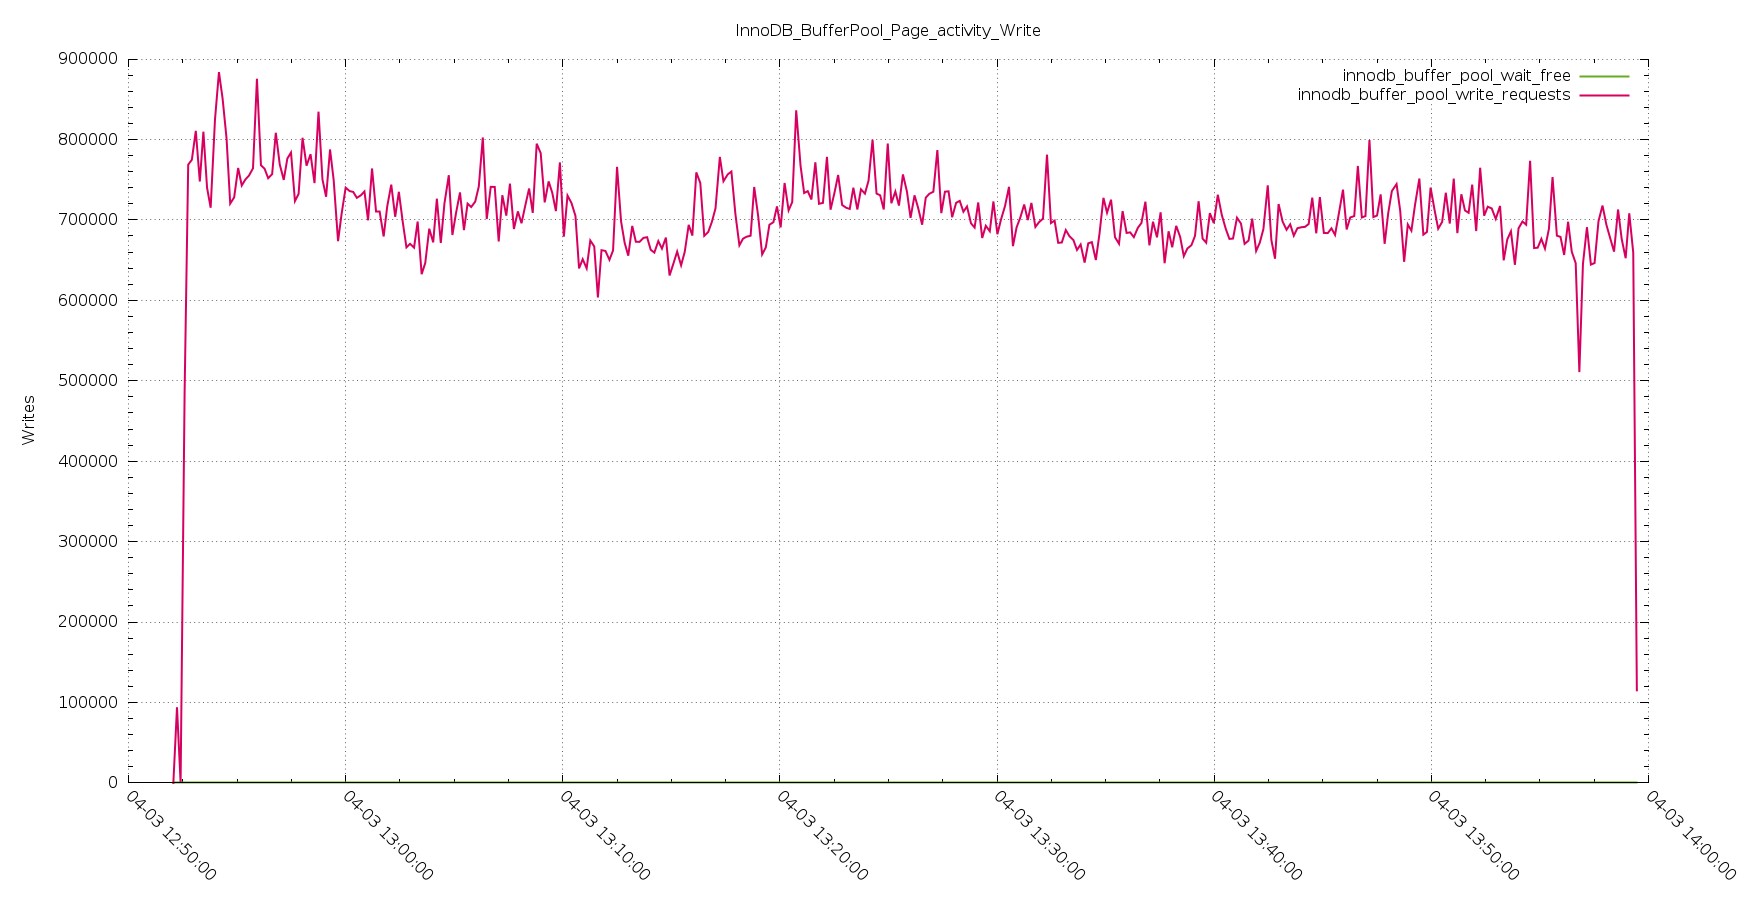
The trend shown by the handler stay consistent in the page management and rows insert, as logically expected.
Second test Application ingest
As mention this test see many threads from different application servers inserting by batch of 50 statement against multiple tables.
The results coming from this test are quite in favor to Aurora, as we can see starting from the time taken to complete the same workload:
LB
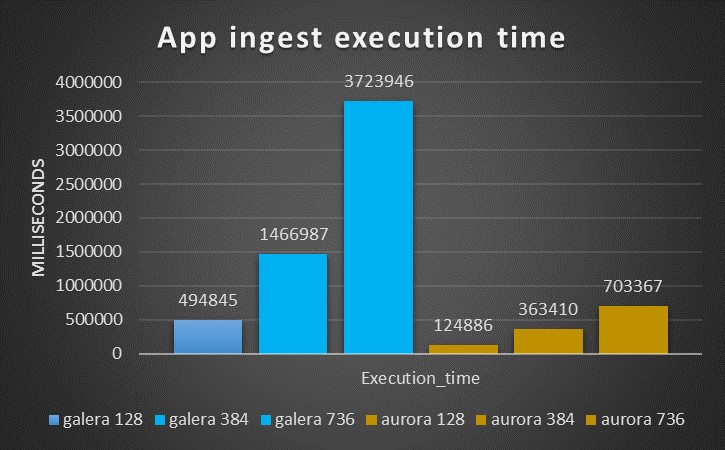
SB
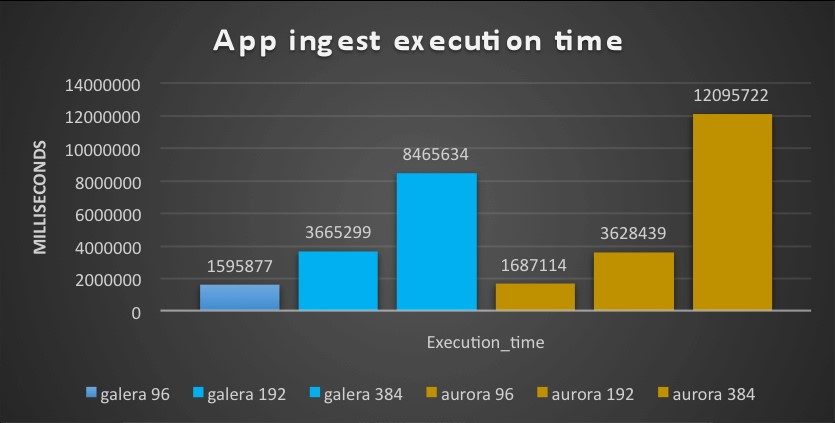
While with small ones the situation was the inverse.
But here starts the interesting part.
Aurora is able to manage significantly higher number rows as the picture below shows
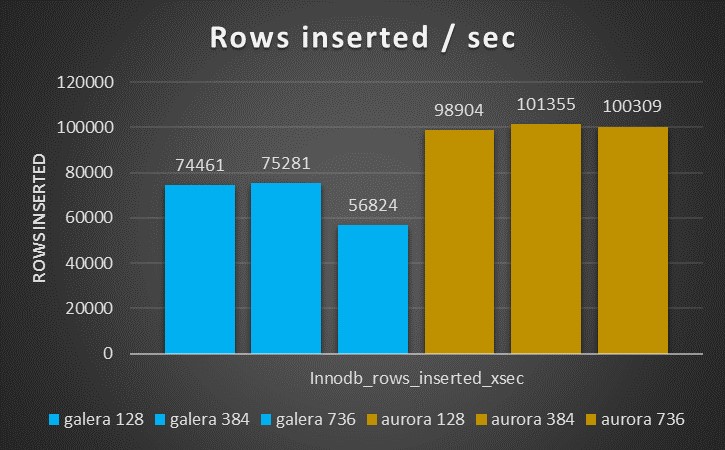
The results are also quite constant and not significantly decreasing like the inserts with PXC.
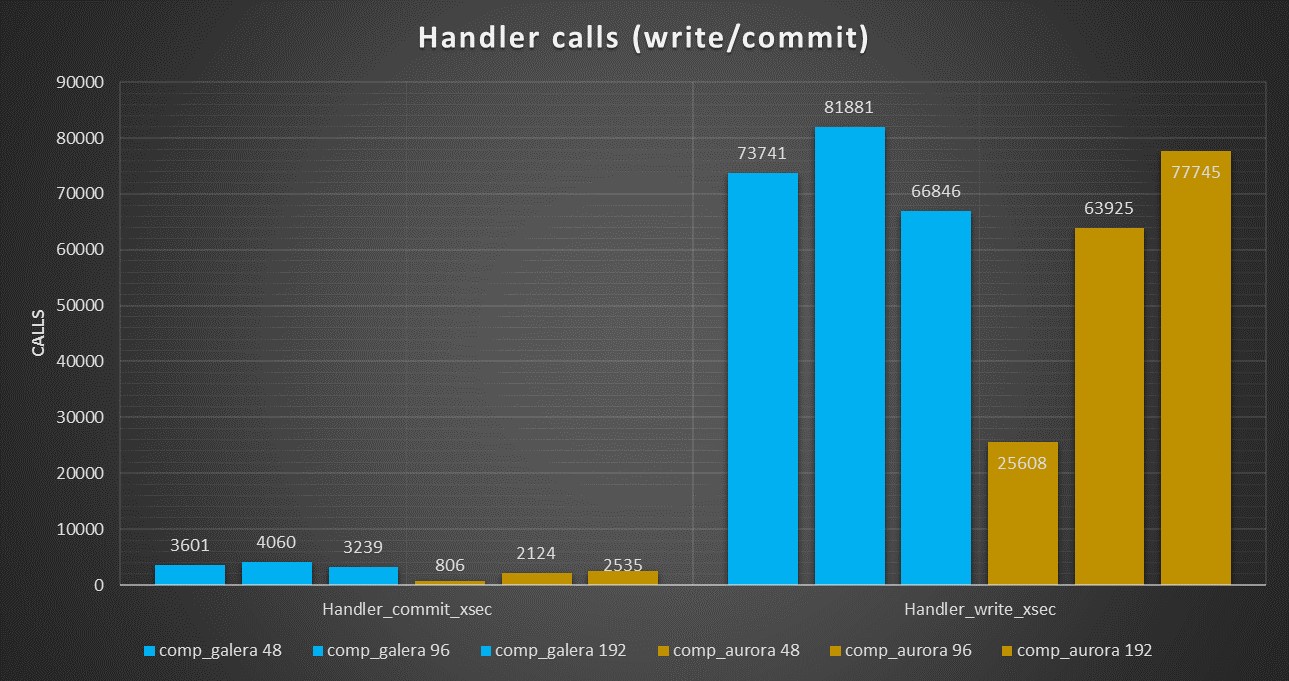
But the number of Handler commits are significantly less.
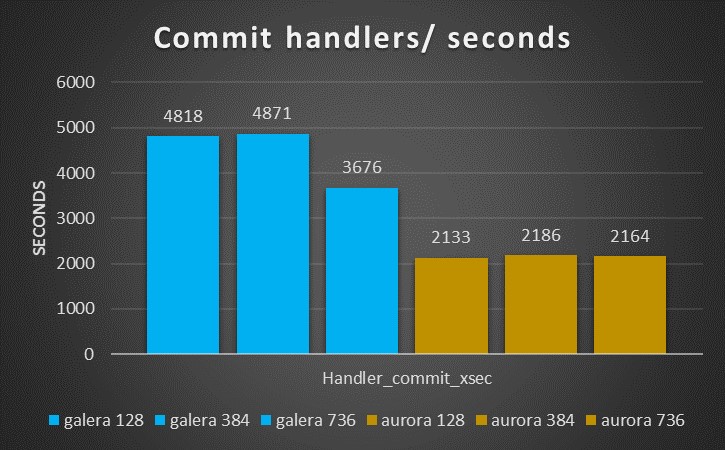
Once more they stay the same on the load increase, without impacting performance.
Reviewing all Handlers call we have a first surprise
PXC Handlers calls
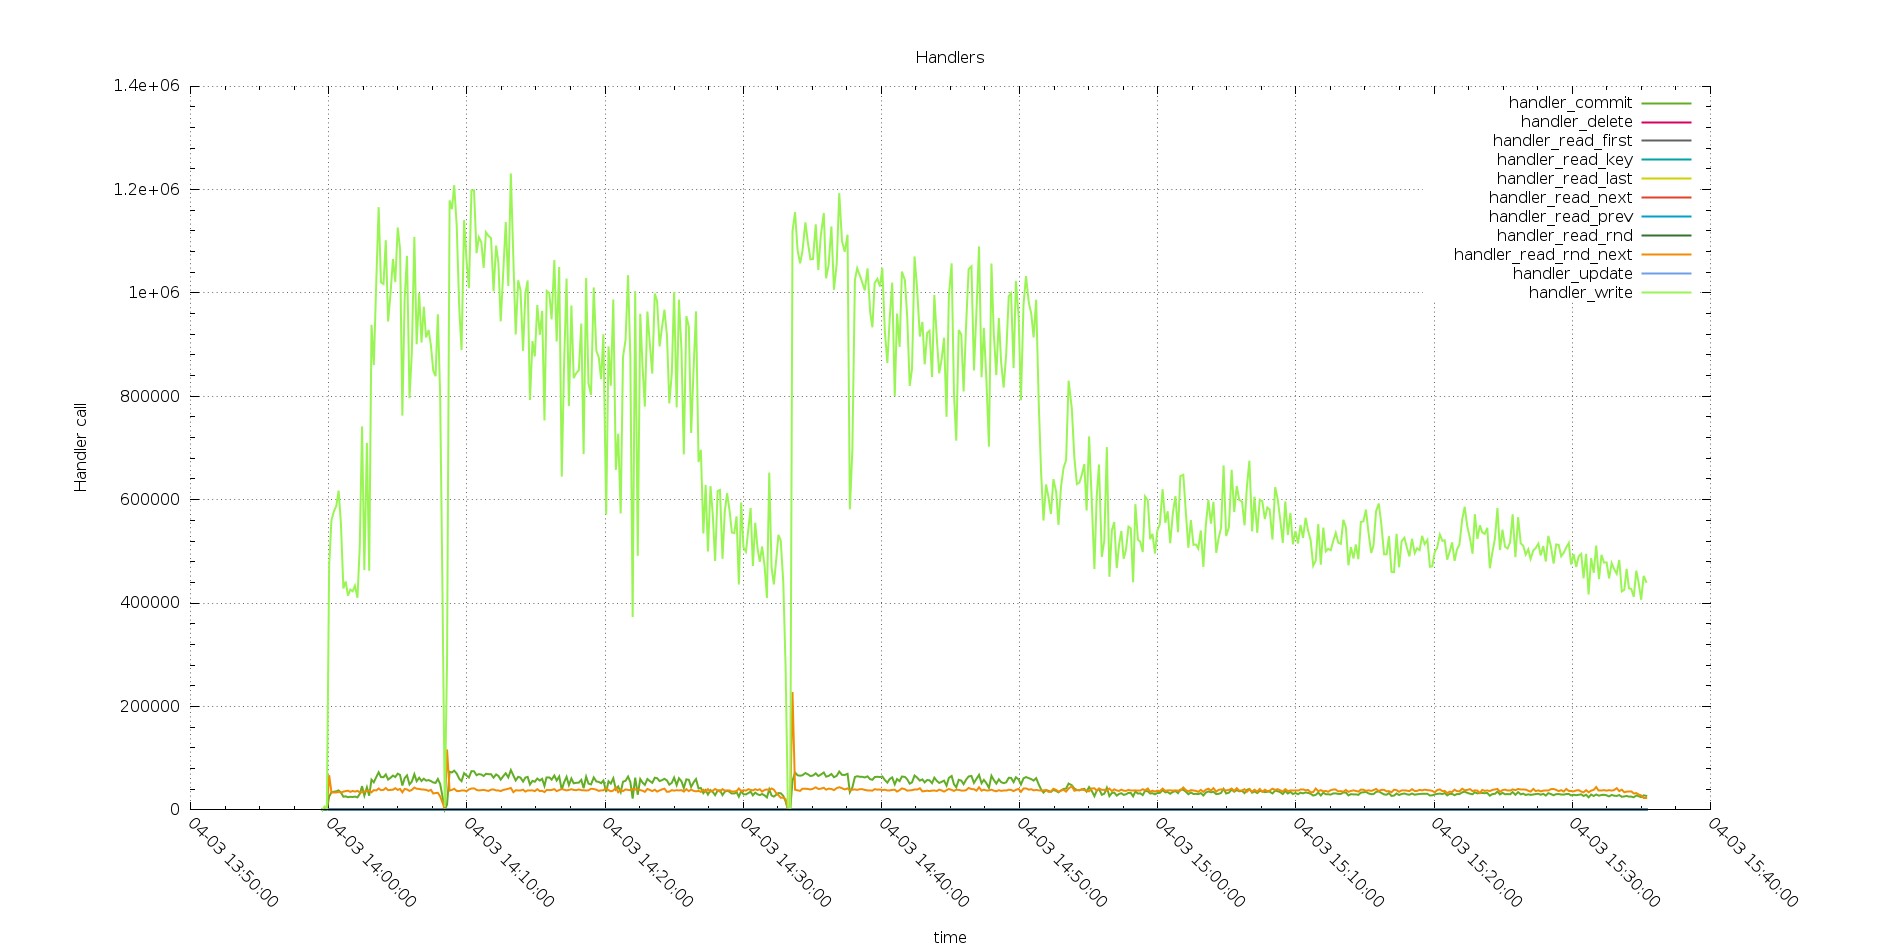
Aurora Handlers calls
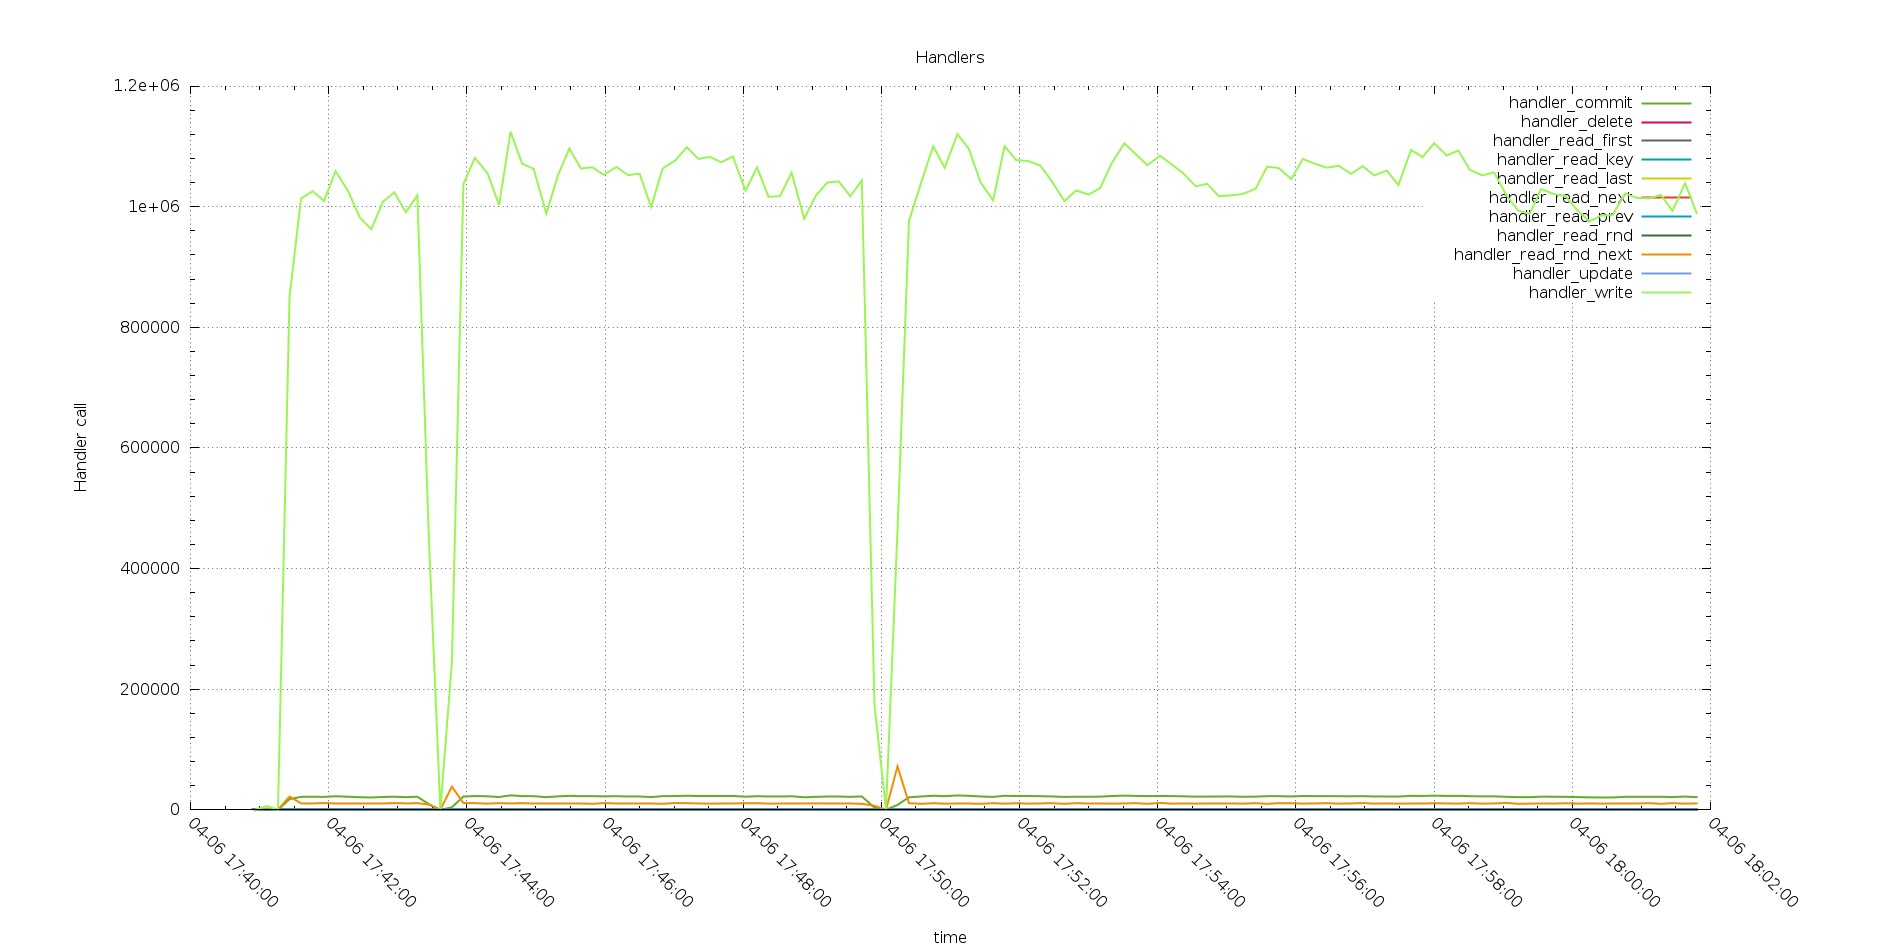
The gap/drop existing in the two graphs are the different tests (with increasing number of threads)
We have two things to notice here, the first one is that PXC has a decrease in performance while processing the load, while Aurora has not. The second (you need to zoom the image) the number of commit is floating in PXC while it stays fix in Aurora.
Even bigger surprise comes up when reviewing the connections graphs.
As expected PXC is having all my connections open there and the number of threads running is quite close to what is the number of the threads connected.
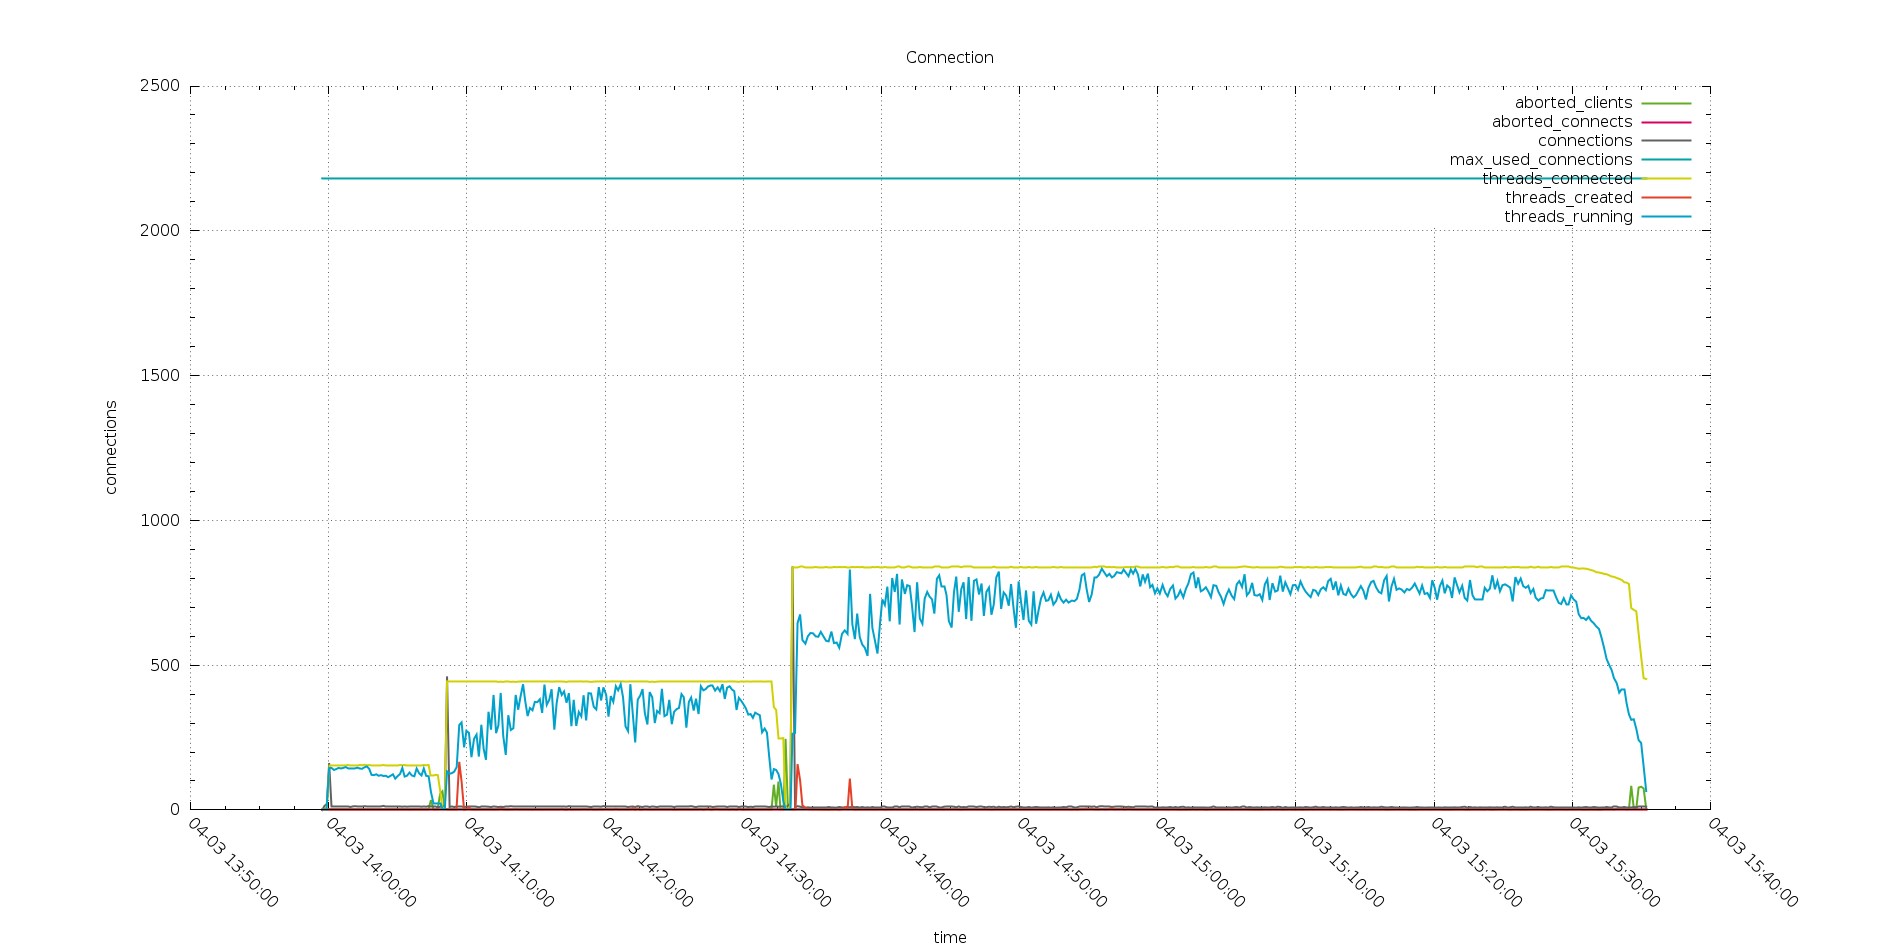
And both of them follow the increasing number of connected threads.
But this is not the case in Aurora.
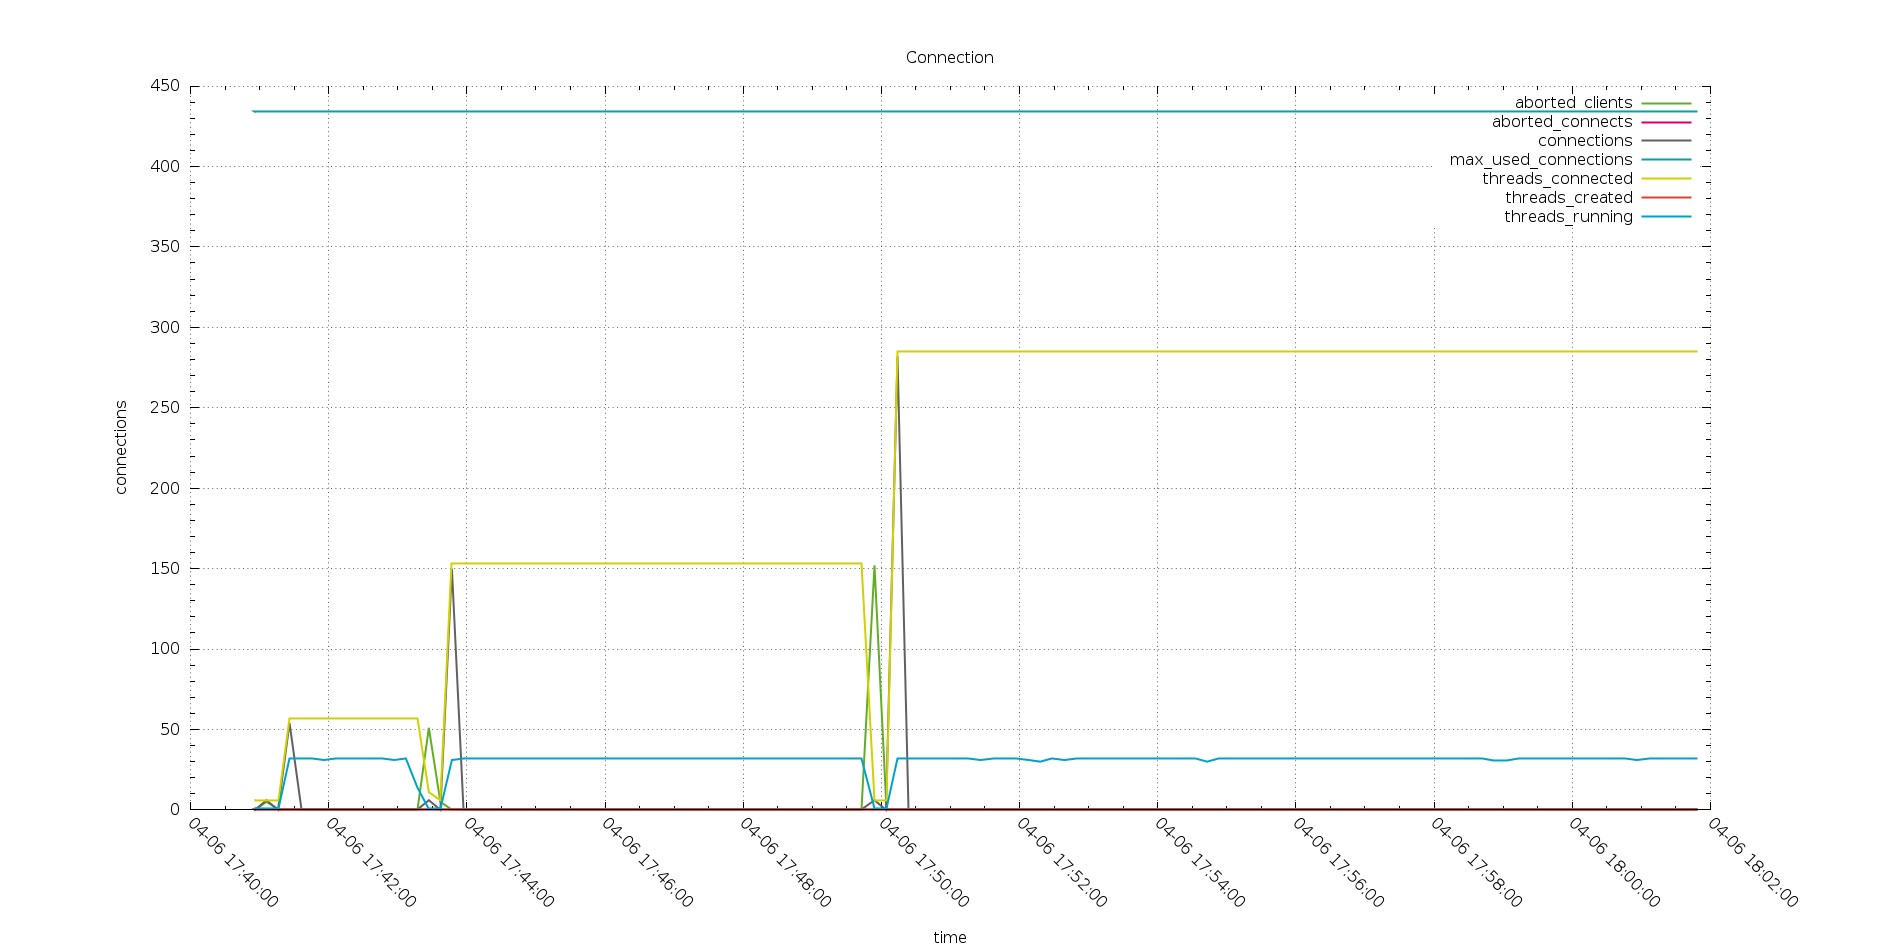
Also if my applications are actually trying to open ~800 threads, the Aurora node see only a part of them, and the number of running is fix to 32 threads.
Thing to consider here are the following, first my applications does not connect directly to Aurora instance, but to a connector (MariaDB). Second Aurora, in this case, cap the number of running threads to the number of CPU available on the instance (here 32).
Given that I may expect to have worse performance, but I do not.
The fact that Aurora use one thread for multiple connections seems working quite efficiently here.
See also the number of Rows inserted is consistent with the handler calls and better performing than PXC.
Aurora Rows inserted
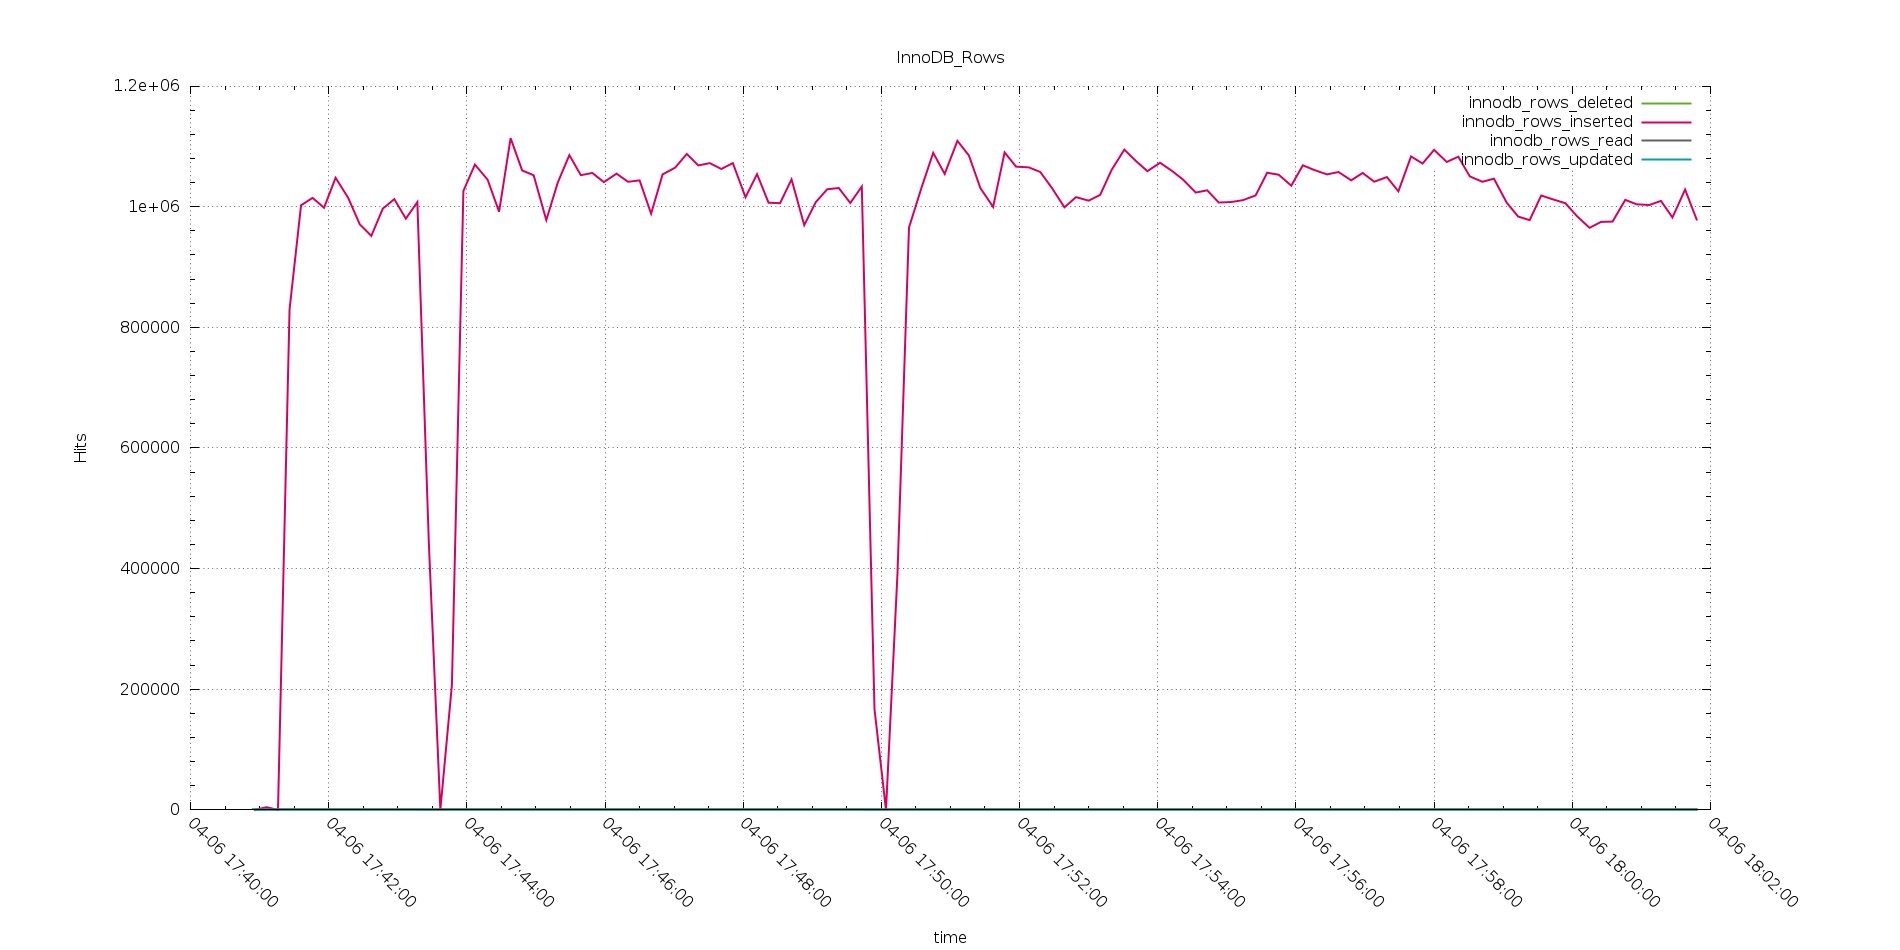
PXC Rows inserted
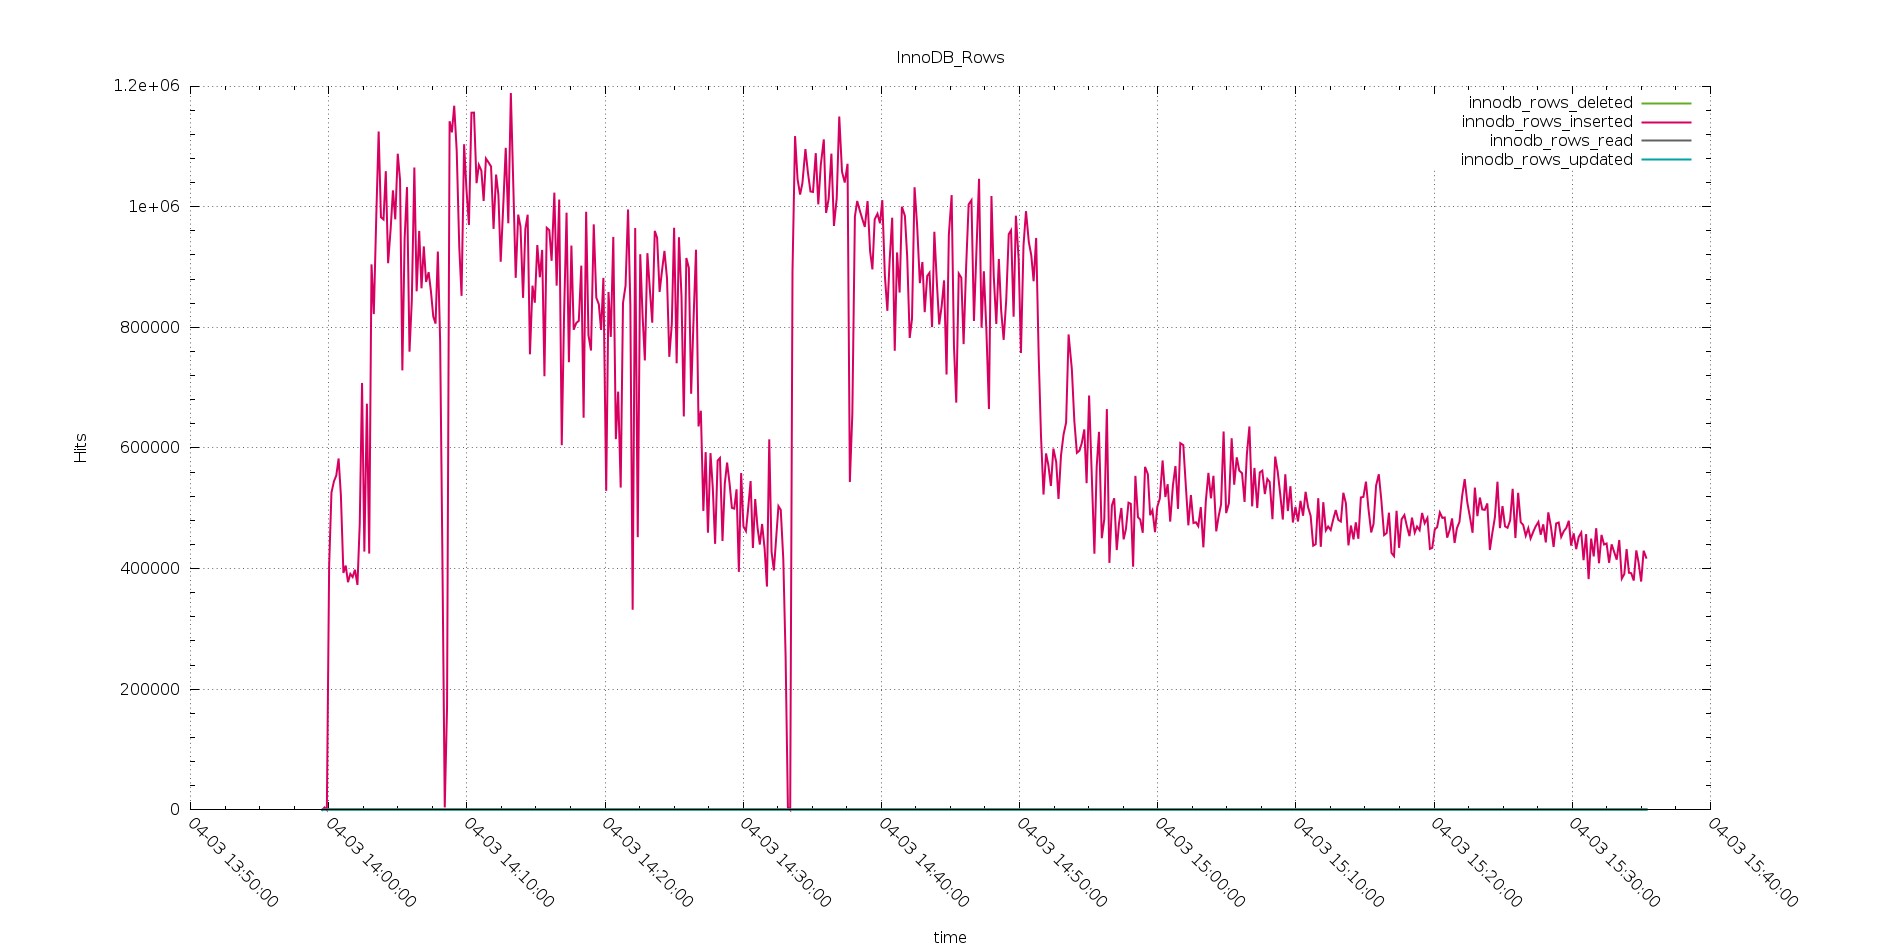
Again we have the same trend, only this time we have Aurora able to perform definitely better than PXC.
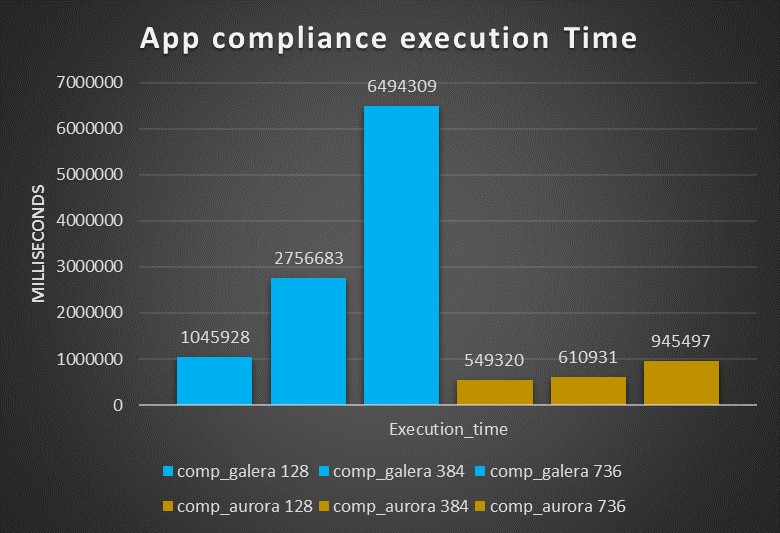
Third test: OLTP application
When run on the small boxes this test saw PXC performing tons’ time better then Aurora,
The time taken by Aurora was ~3 times the one taken by PXC
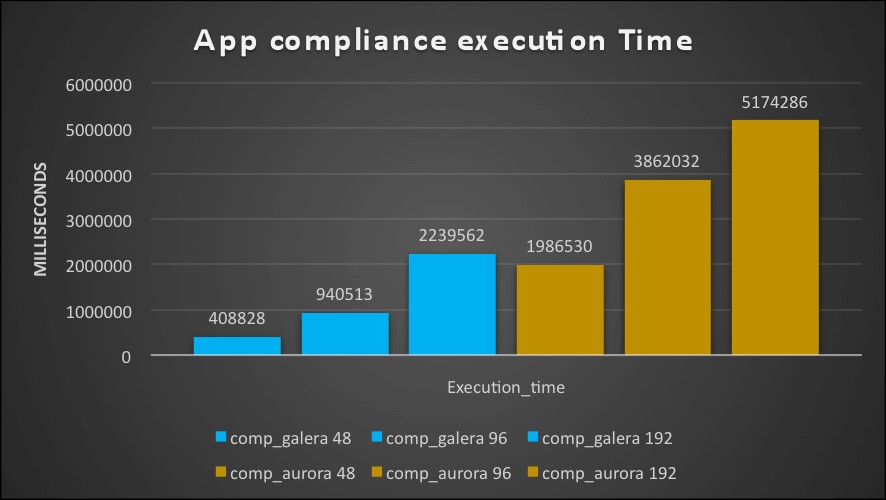
With large box I had the inverse, Aurora is outperforming PXC by many times, being from two up to almost 7 times faster then PXC.
Analyzing the number of commands executed with increasing workload, we can see how PXC is able to perform better than Aurora with a workload of 128 threads, but is starting to have worse performance as the load increase.
On the other hand, Aurora is able to manage the load and in read/write without significant performance loss, that include being able to increase the number of commits/sec.
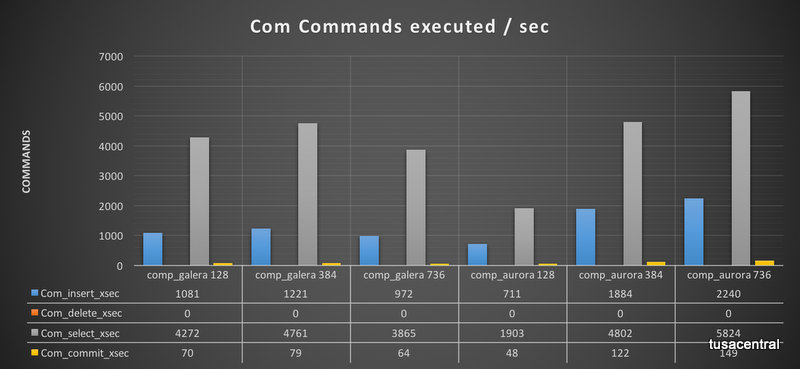
Reviewing the Handler calls, we see gain that the Handler commit calls are significantly less in Aurora as already noticed in the ingest tests.
The other thing to notice, is that the number of calls for PXC is significantly higher and not scaling, while Aurora has a nice scaling trend.
Forth Test: TPCC-mysql
Tpcc test is main to test OLTP traffic, with the note that some tables like district my become a hotspot. The tests I run were executed against 400 warehouse and using 128 Threads as maximum for the small box and 2048 threads for the Large.
During this test I hit one of the Aurora limitation and I had escalated that to the Aurora engineers, who are aware of the problem.
Small boxes
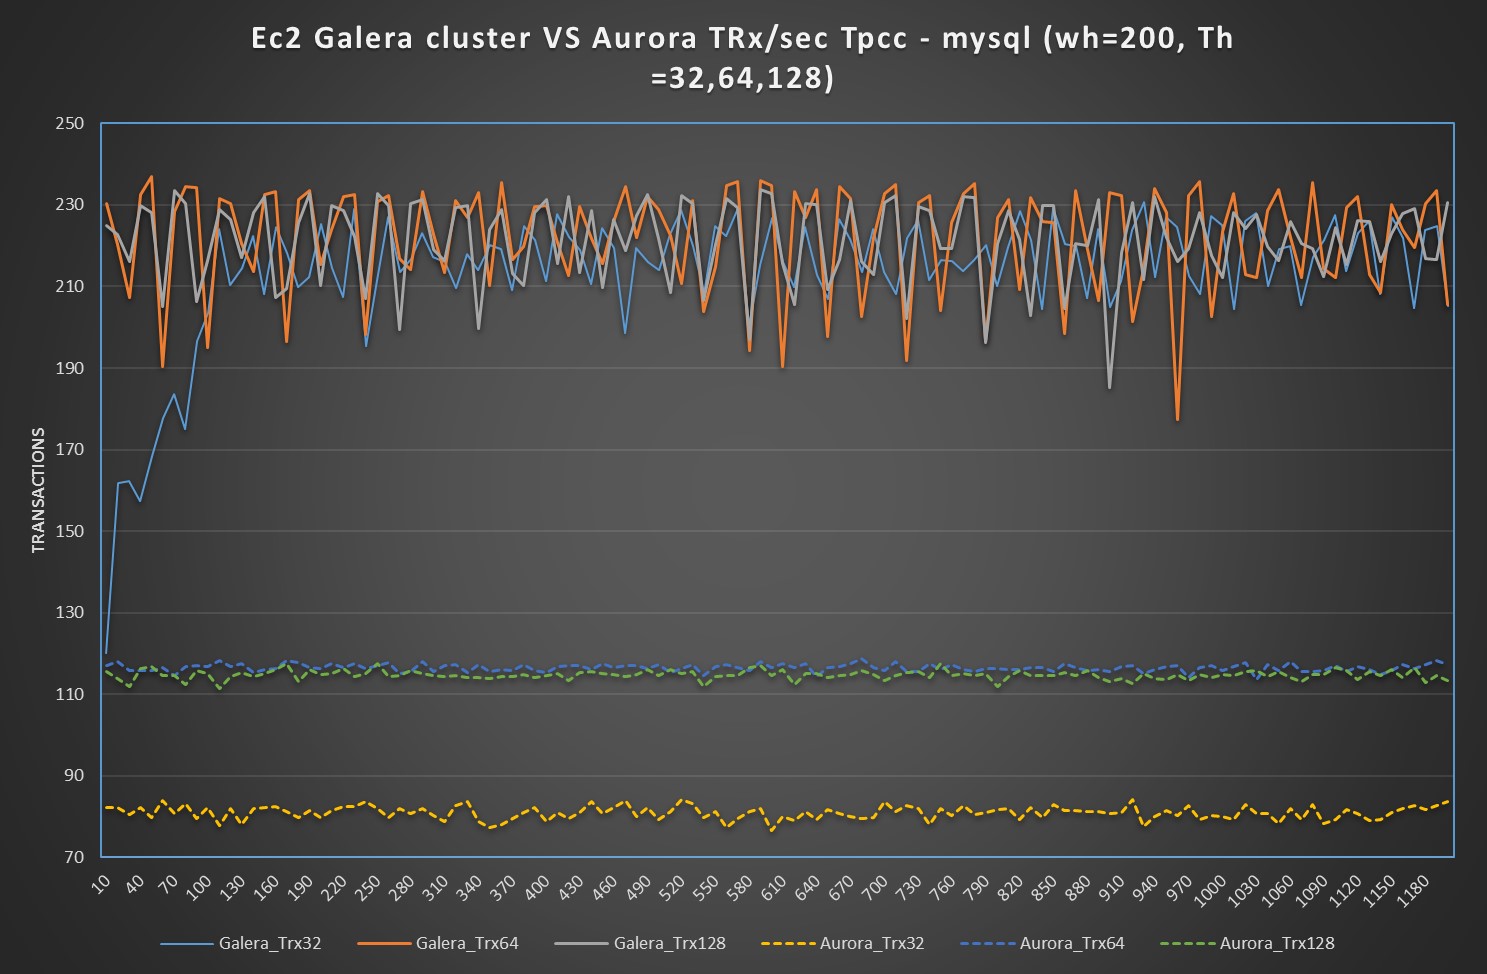
In the case of small boxes, there is nothing to say, PXC is able to manage the load more efficiently, also if his trend is not optimal having significant fluctuation. Aurora is just not able to keep the it up.
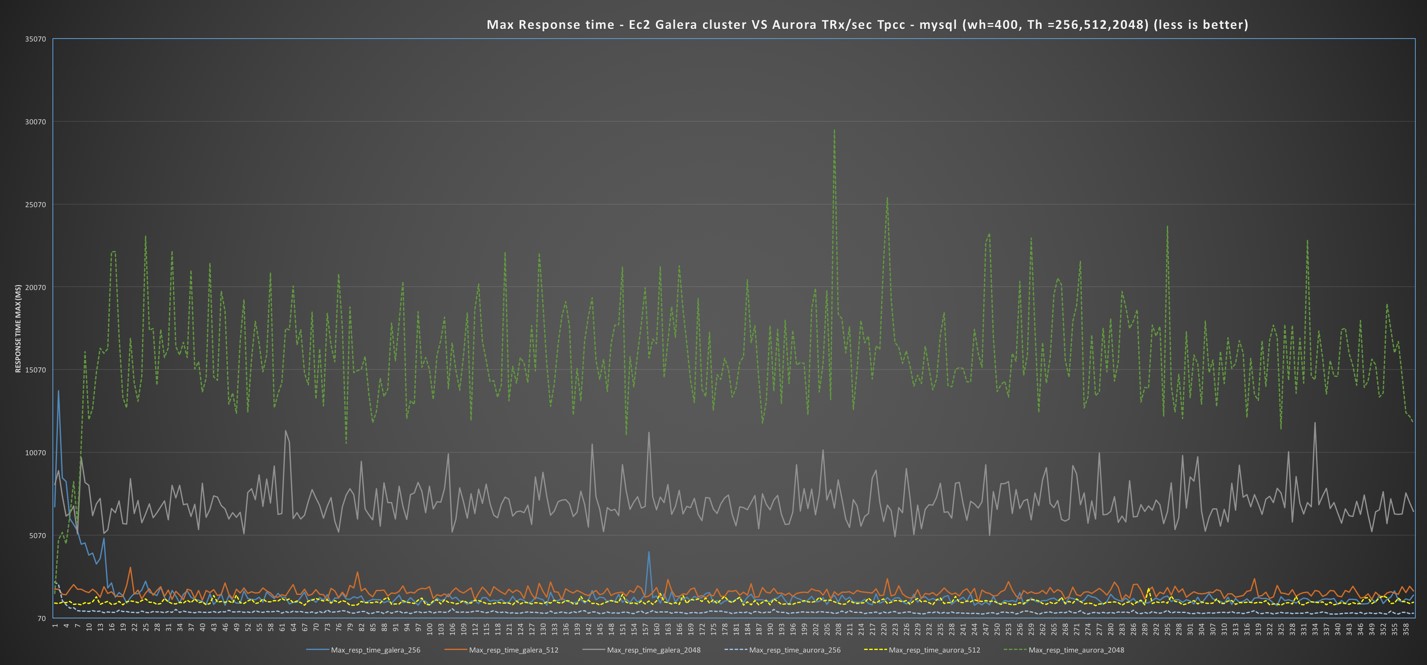
Large boxes
Different and a bit more complex scenario in the case of the use of large boxes.
I would like to say that Aurora is performing better:
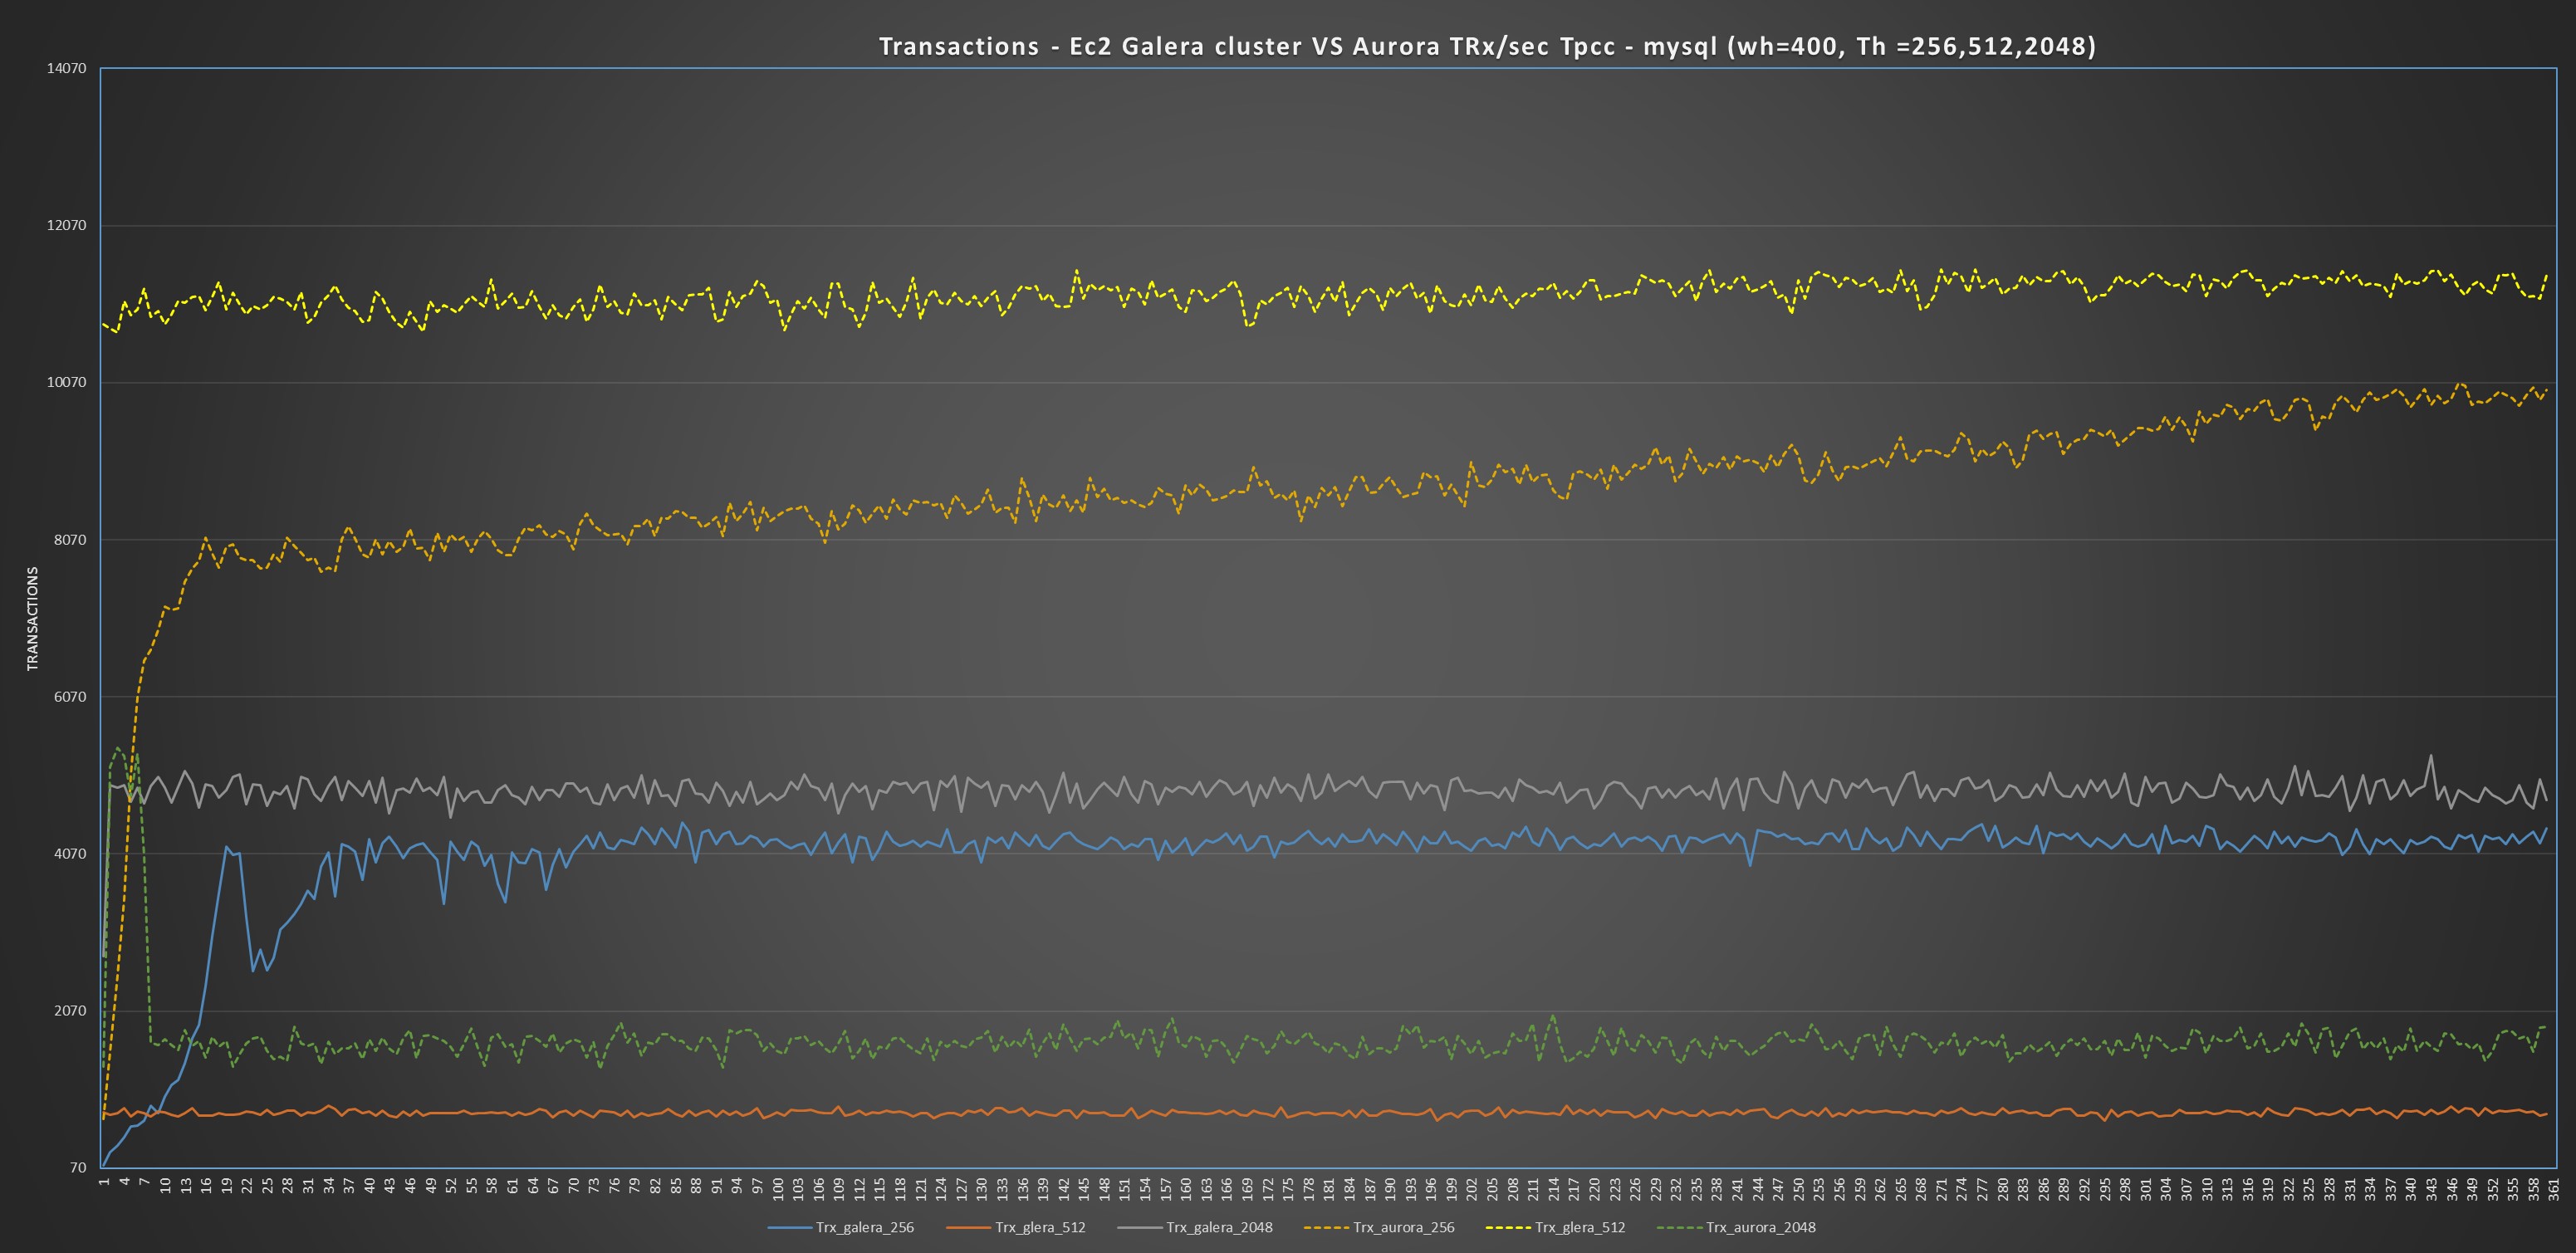
And as you can see this is true for 2 tests over 3, and up to when it got stuck by internal limitation, Aurora was also performing better on the 3td. But then its performance just collapse.
Performing more in depth investigation I noticed that under the hood, Aurora was not performing as well as it looks like.
That comes out quite clear performing comparison between few graphs covering Comm_ execution, Open Files, Handlers and Innodb row lock time.
In all of them is quite evident how PXC is able to keep serving the workload with consistent behavior, while Aurora fails from the second test on (512 threads), and not only on the 3td with 2048 threads.
Aurora
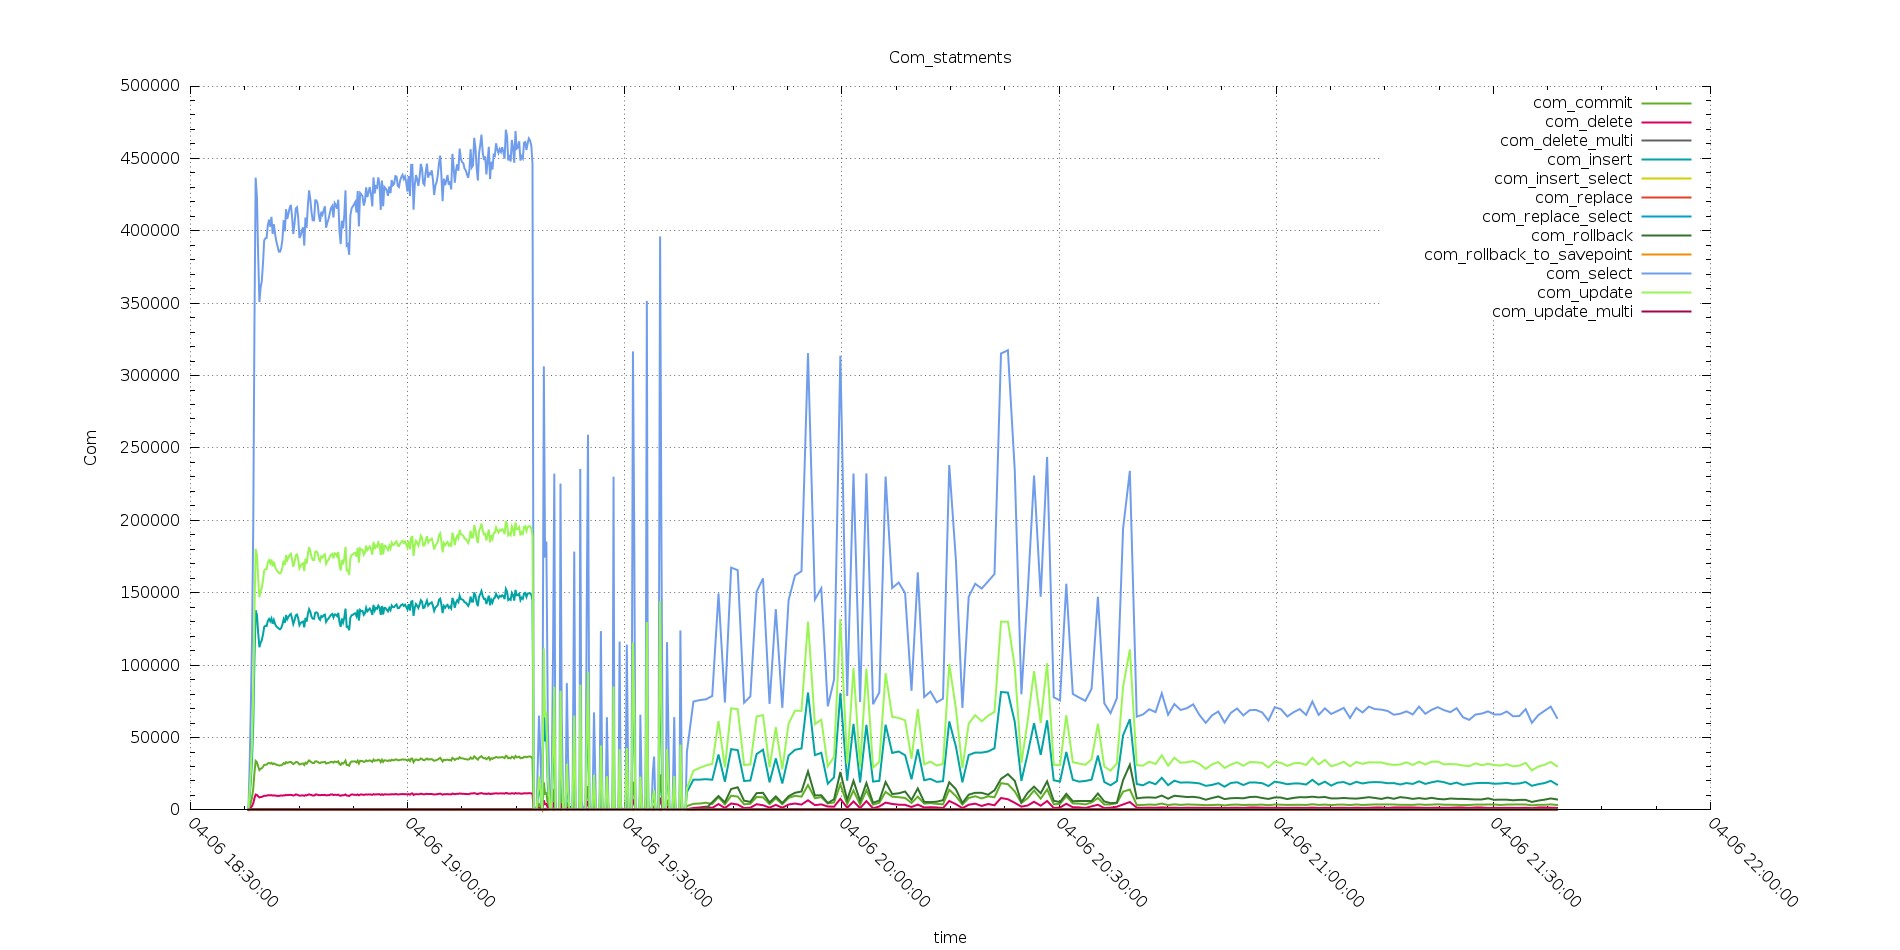
PXC
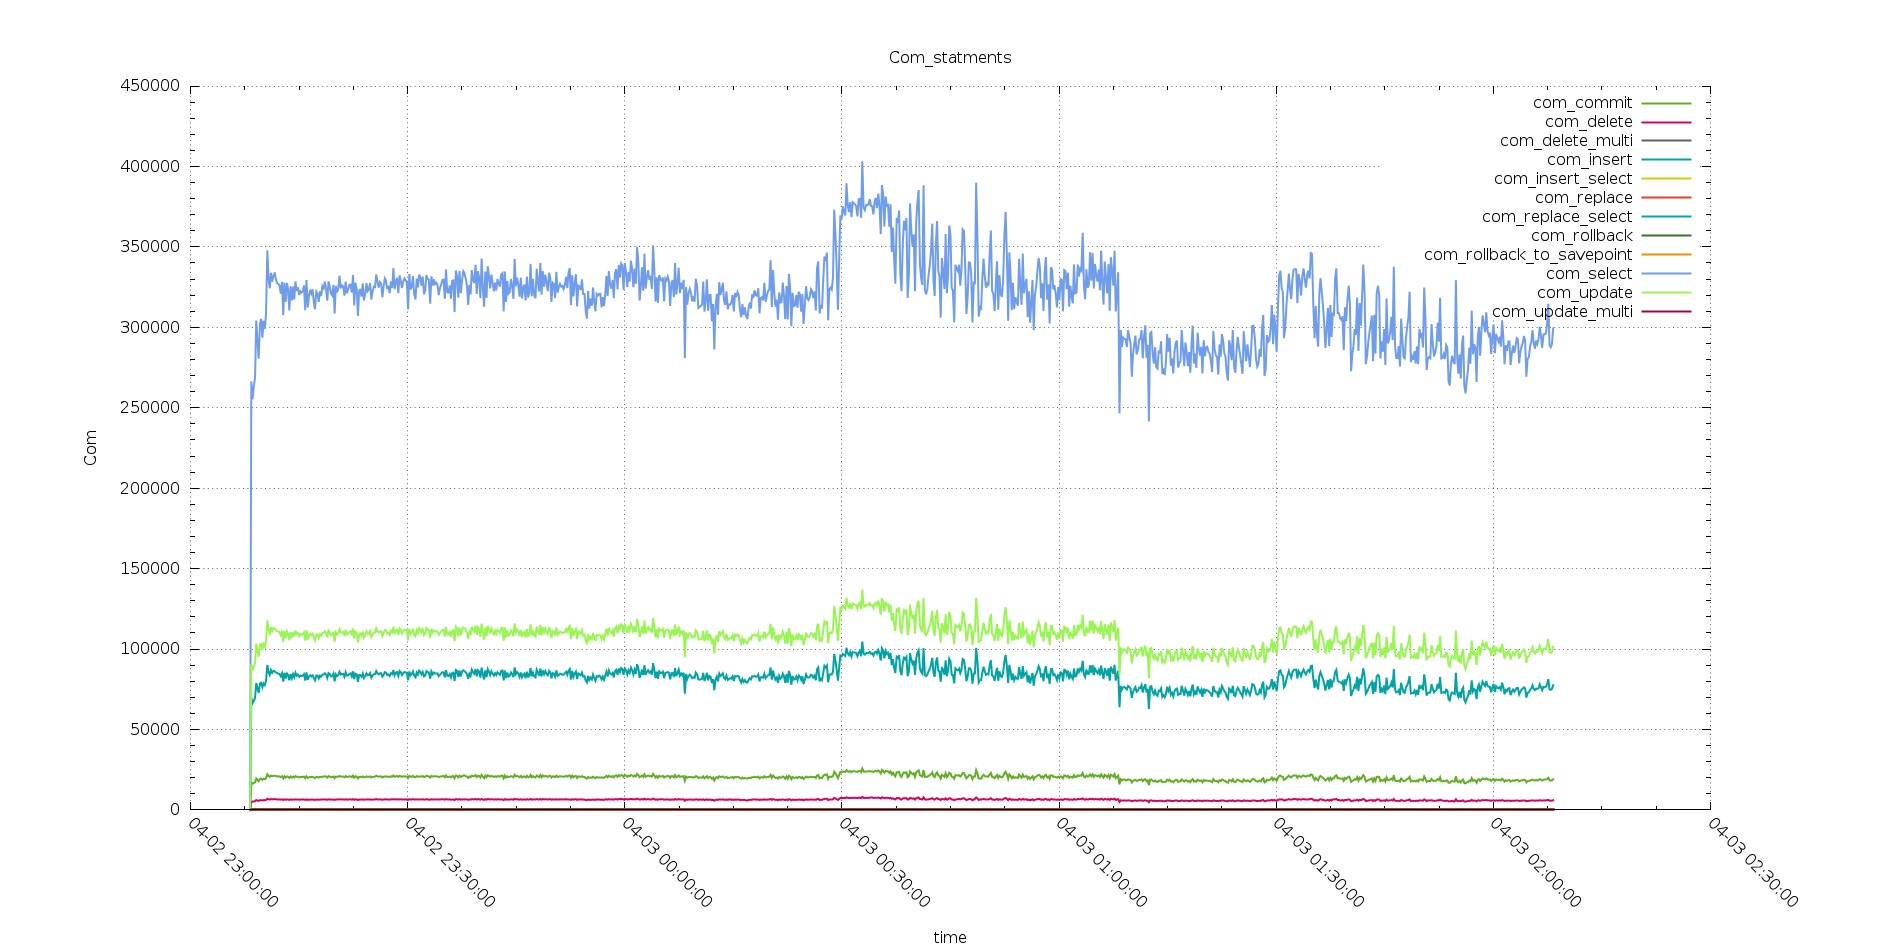
It is clear how Aurora was better serving during the test with 256 threads going over the 450K com select serve (in 10 sec interval), comparing with PXC that was not able to go over 350K.
But in the tests after while PXC was able to keep going, also if with decreasing performance, Aurora was starting to struggle, with very inconsistent behavior.
This was also confirmed by the open files graph
Aurora
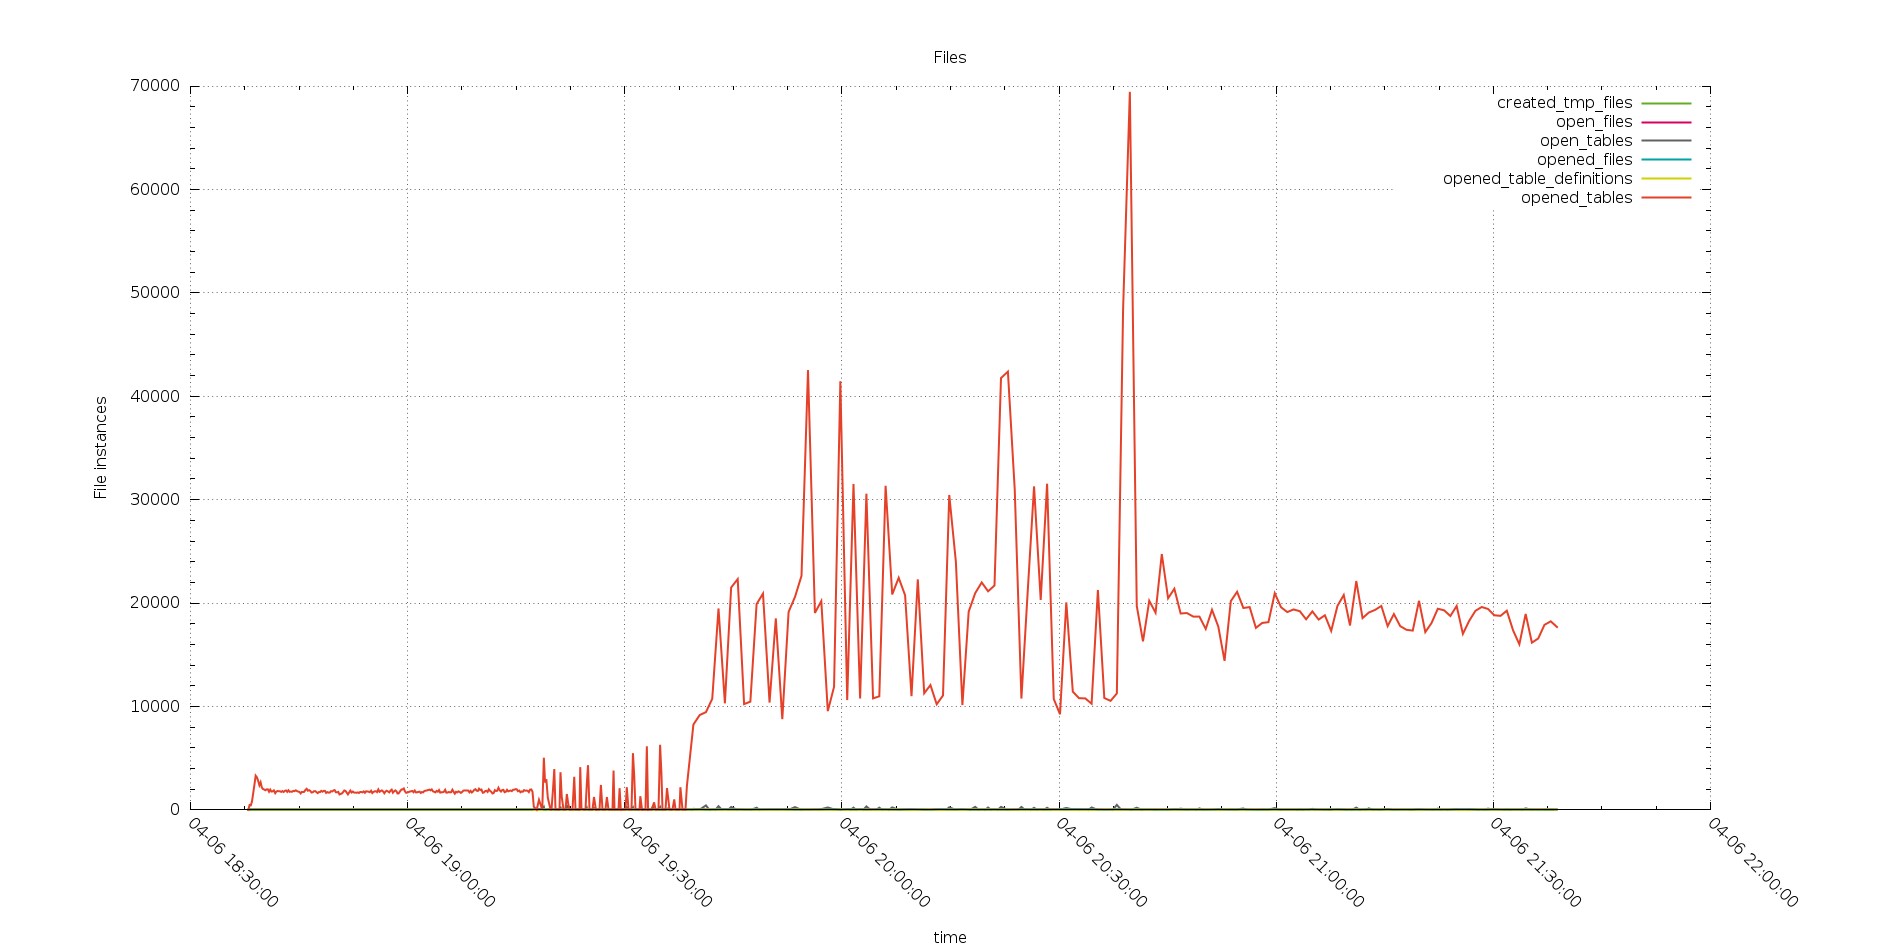
PXC
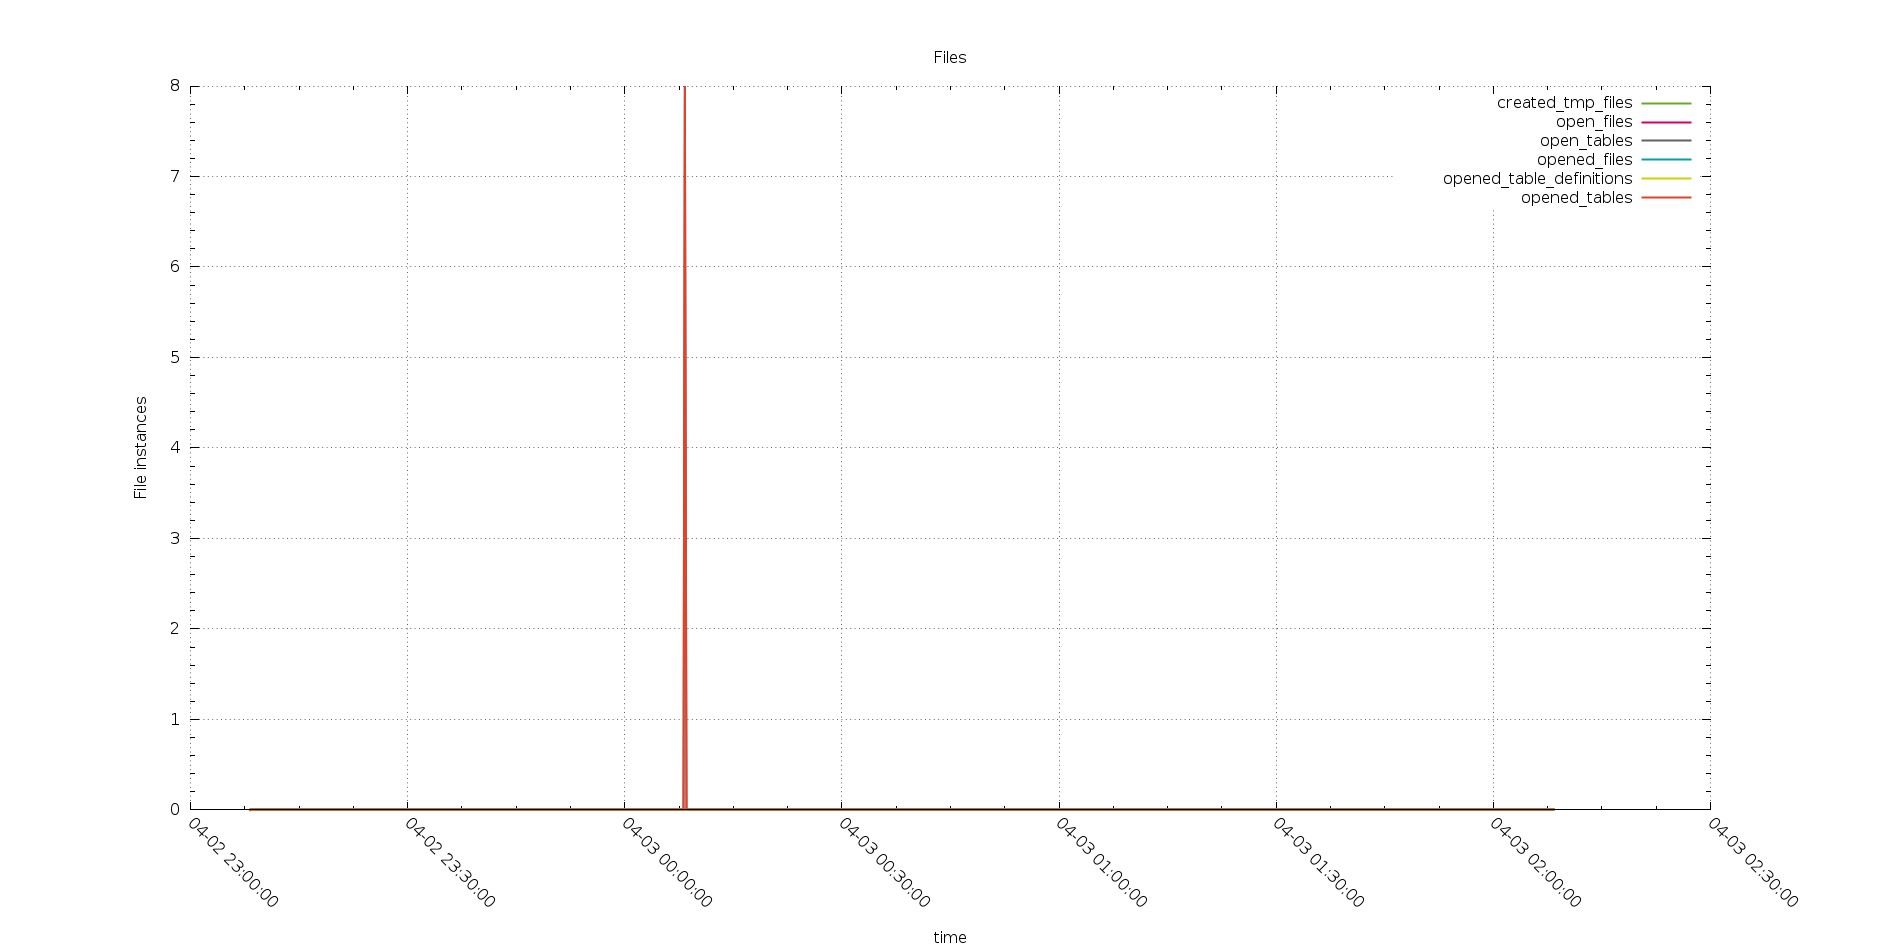
The graphs show the instance of files open during the running, not the one already open.
It reflect the Open_file metric “The number of files that are open. This count includes regular files opened by the server. It does not include other types of files such as sockets or pipes. Also, the count does not include files that storage engines open using their own internal functions rather than asking the server level to do so”. I was quite surprise by the number of files open by Aurora.
Handlers as well were reflecting the same behavior
Aurora
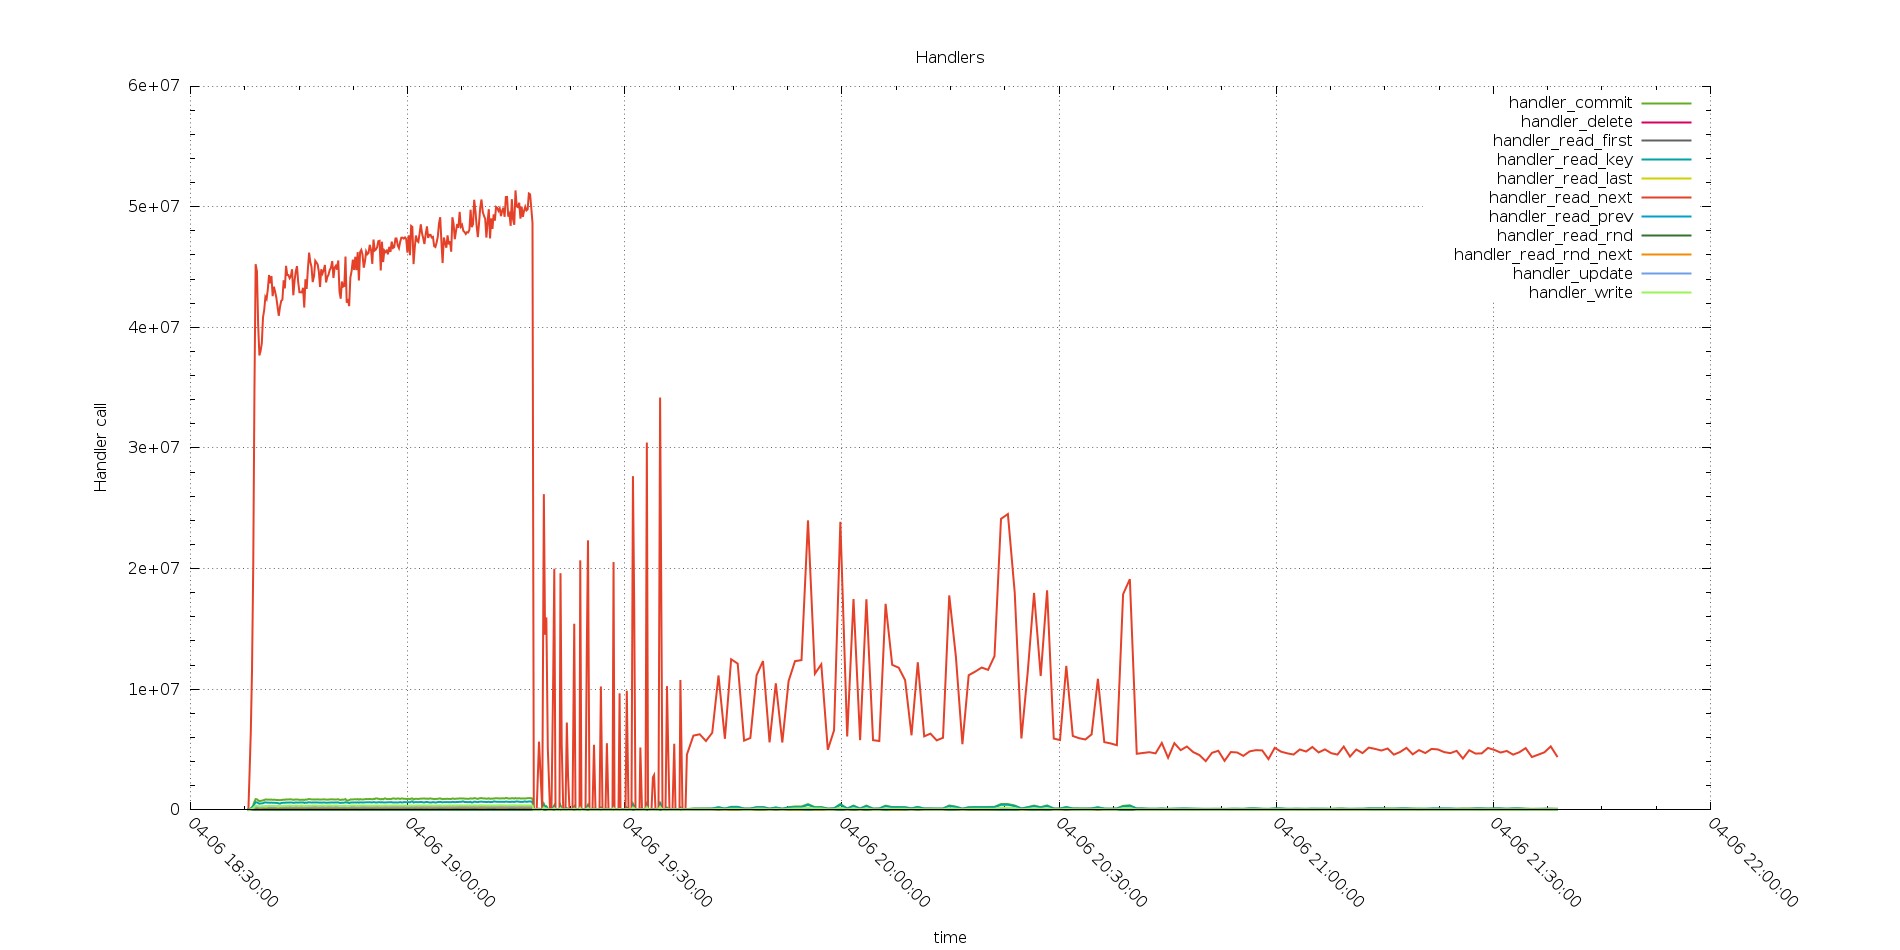
PXC
Perfectly in line with the Com trend.
So what was instead reversely increasing?
Aurora
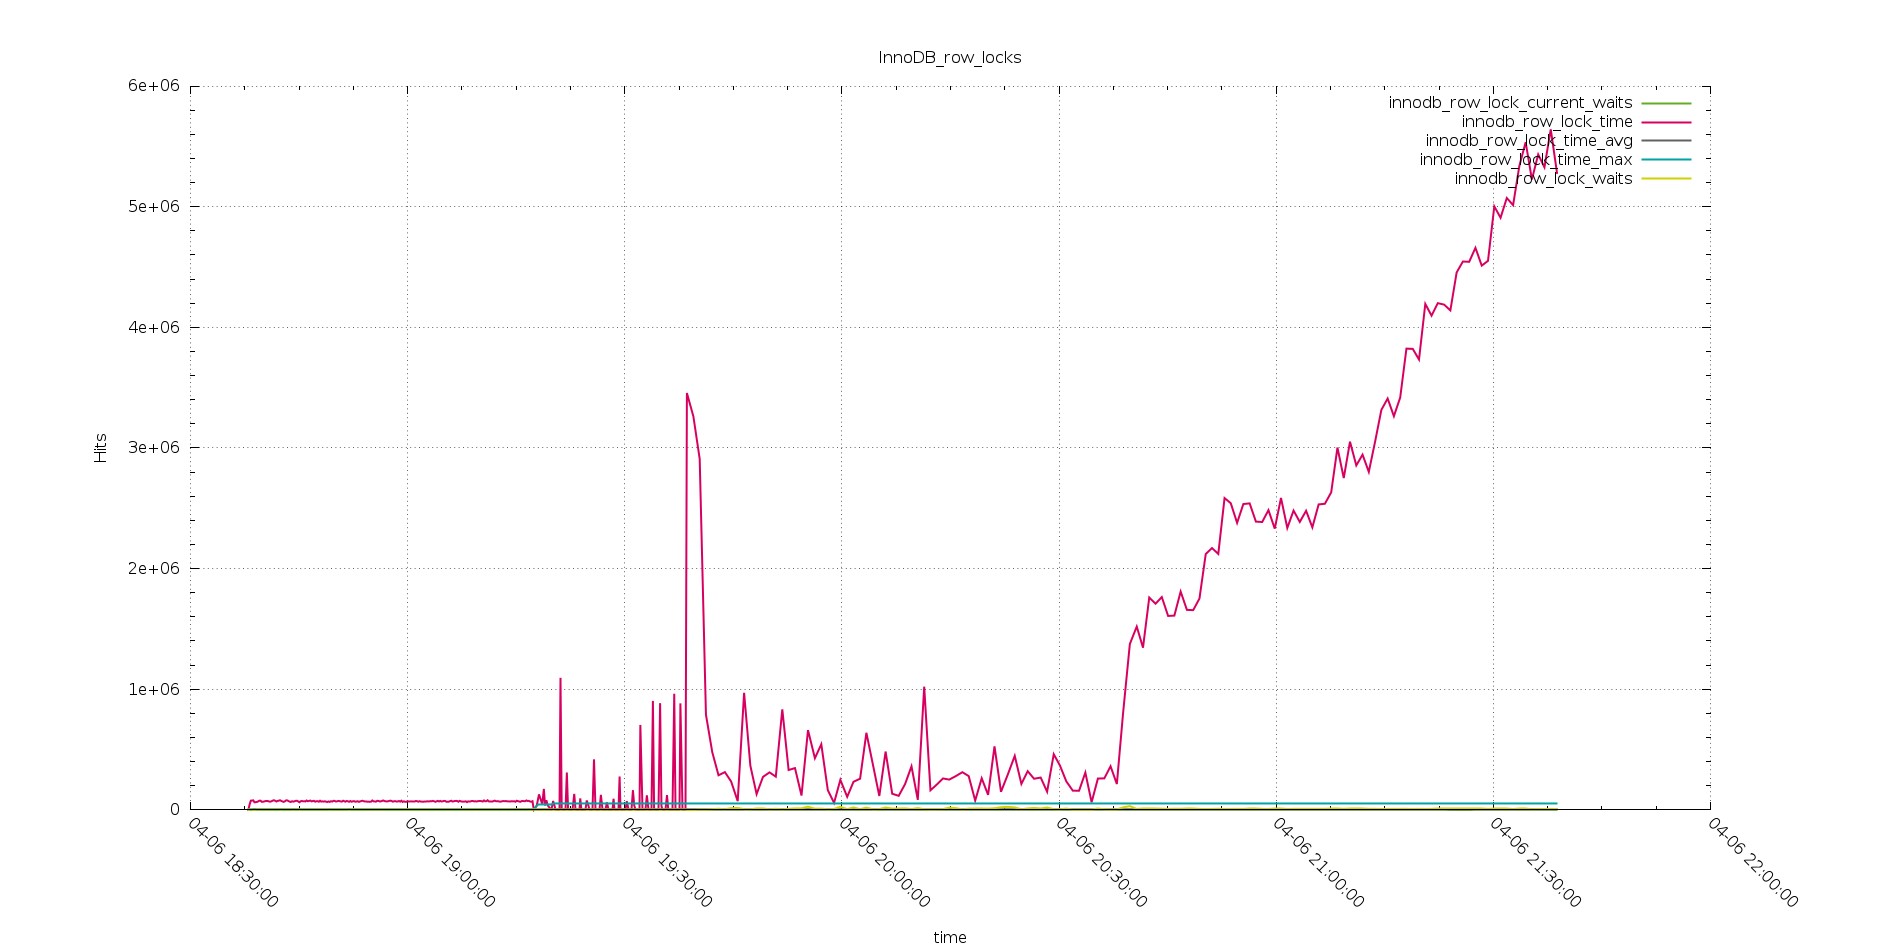
PXC
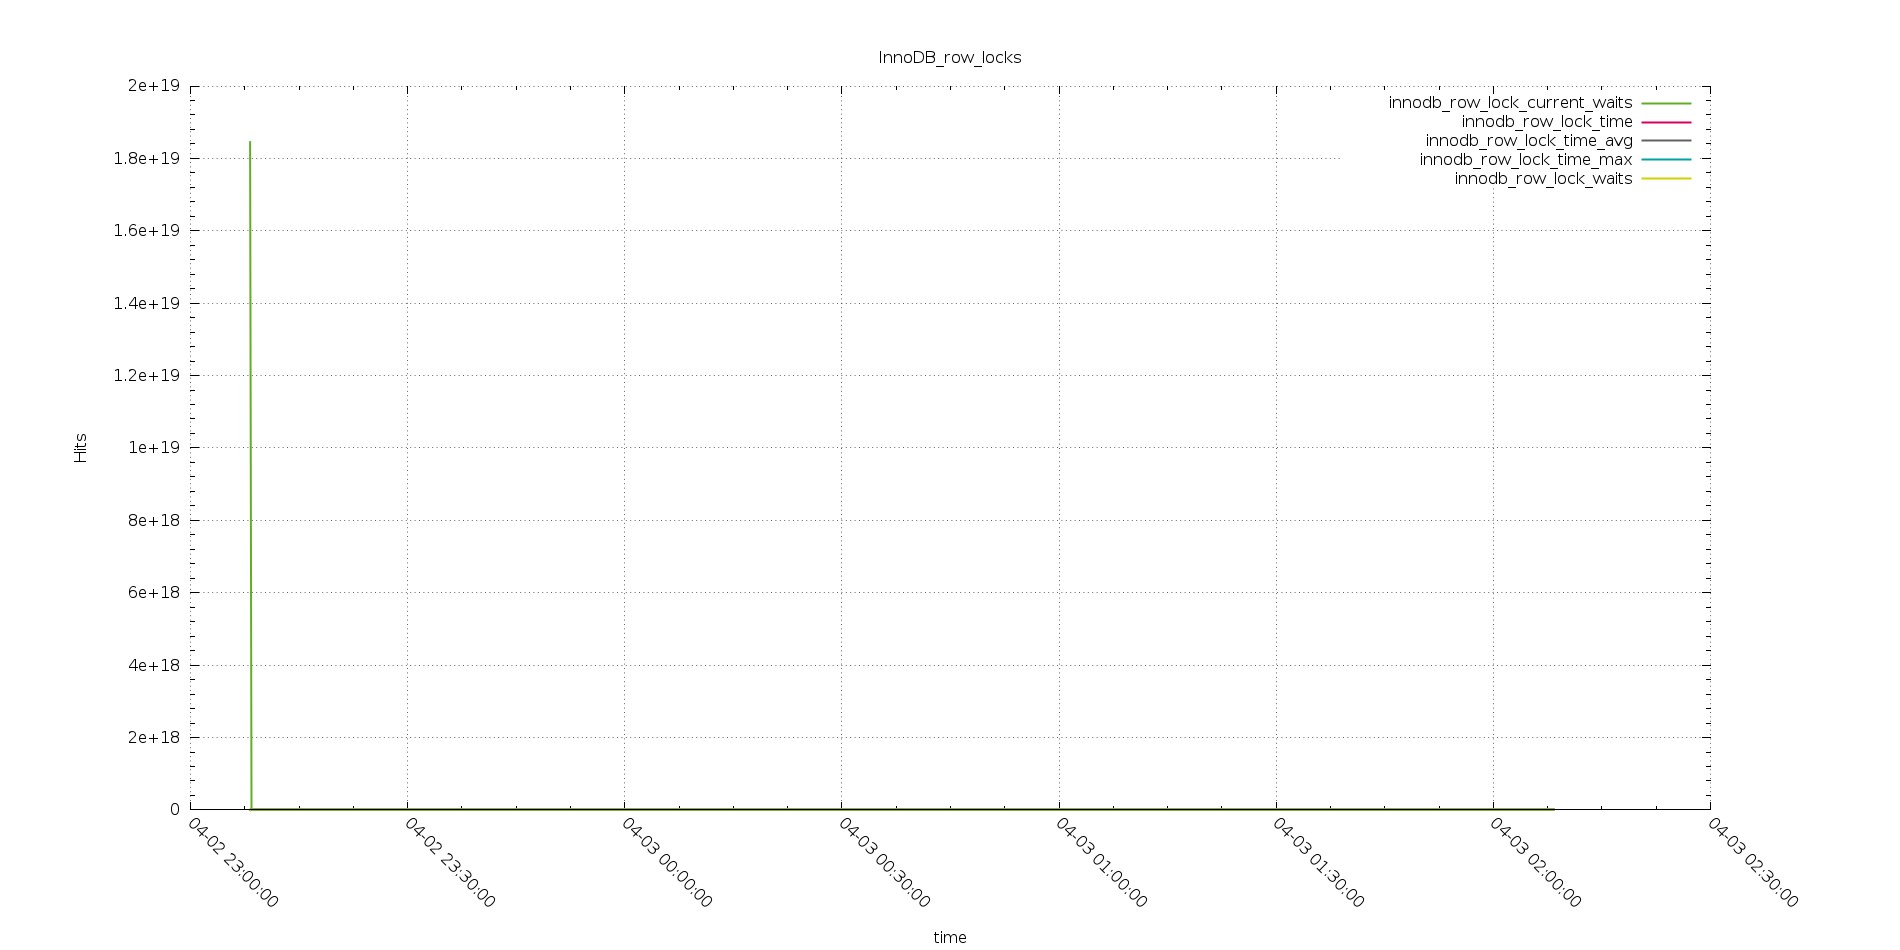
As you can see from the above, the exactly same workload, had generate an increasing lock row time, from quite low in the test with 256 threads, up to crazy high in the one with 2048 threads.
As mention we know that TPCC has a couple of tables that works as hotspots, and we had already saw with IIbench how Aurora is not working efficiently in that cases.
As additional information during the tests, I was getting a lot of 188 errors, this is an Aurora internal error. When I report it, I was told, they know about it, and they are planning to work on it.
I hope they will do soon, because if this issue is solved it is very likely that Aurora will not only be able to manage the tested workload, but go over it by far.
I am saying this because also with the identified issues Aurora was able to keep going and manage a more then decent response time during the test2 with 512 threads.
Fifth test: Sysbench
I add the sysbench tests to test the scalability, and to see the what happen when the system reaches the saturation point.
This test brought up some limitation existing in the Aurora solution, more related to the connector than the Aurora engine itself.
Aurora has a limit of 16k connection, as said I was looking to see what happens if I got to saturation point or close to it. It doesn’t matter if this is a crazy high number or not.
What happened is that I was able to have Aurora managing traffic up to 4K but the more I was going close to the limit, the more I was having issue in connectivity, more than anything else.
At the end I had to run the test with 8k 12k and 20k threads pointing directly to the Aurora instance, bypassing the connector that was not able to serve the traffic.
After that I was able to hit up to ~15500 Threads but with a lot of inconsistent performance. Given that I am defining the limit of meaningful test to the previous level of 12K threads.
PXC was able to scale up to 16K no problem.
What also is notable here is that Aurora was able to mange the workload more efficiently in terms of transaction handling as transactions executed and latency.
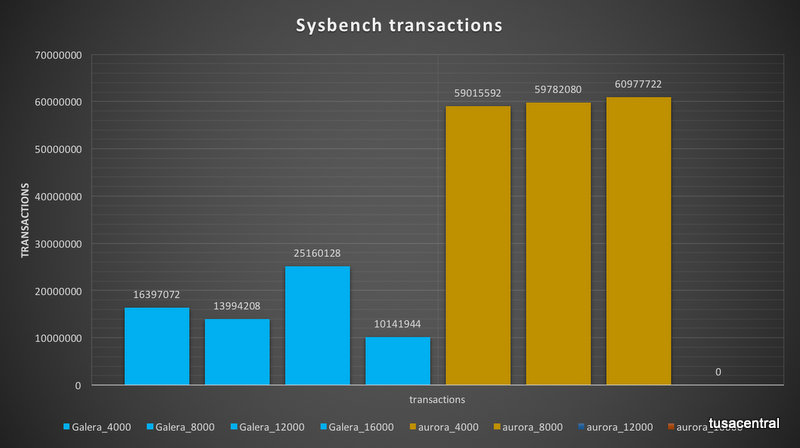
The number of transaction executed by Aurora were ~three times the one executed by PXC.
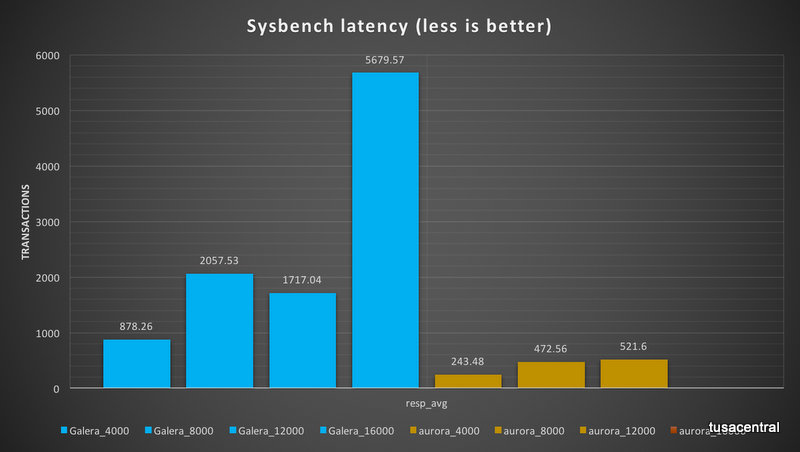
Also in term of latency Aurora was showing less latency then PXC.
Internally Aurora and PXC operations were once more different in terms of how the workload was handle. The most diverging result was the handlers calls.
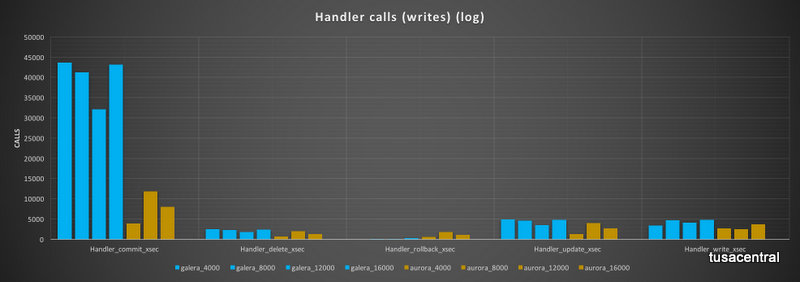
Commit calls in Aurora were a fraction of the calls in PXC, while the number of rollback was higher.
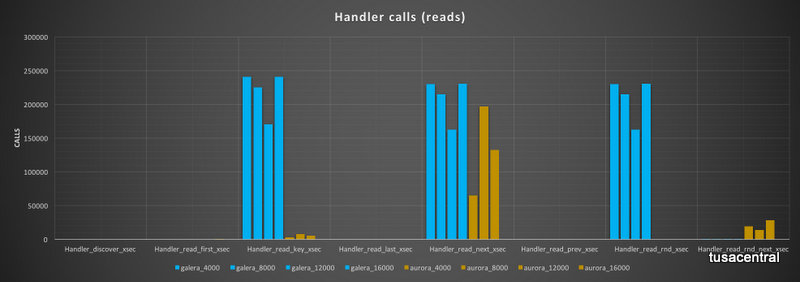
The read calls had an even more diverging behavior, with PXC performing high number of read_keys, while Aurora was having a very limited number of them. Read_rnd are very high in PXC but totally absent in Aurora (note that in Aurora, read_rnd are reported but seems not really increasing). On the other hand, Aurora report a high number of read_rnd_next while PXC has none.
HA availability
Fail-over time
Both solutions
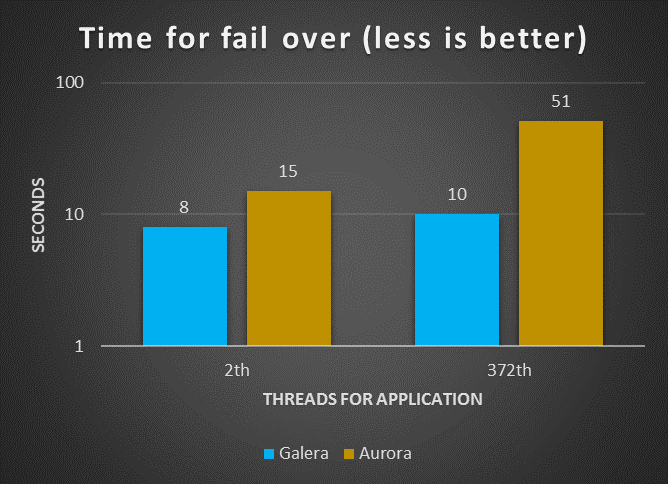
In this test the fail-over time had seen the solution using Galera and HAProxy to be more efficient. That was happening with limited or mid level load, one assumption is that given Aurora has in any case to verify the status of the data transmitted and its consistency across the 6 data store node, the process is not so fast as it could be.
Or, another assumption, it could be that the cluster connector is not as efficient as it should in redirecting the traffic from one node to another. It would be a very interesting exercise to replace it with some other custom solution.
Note that I was performing the tests following the Amazon indication to use the following to simulate a real crash:
ALTER SYSTEM CRASH [INSTANCE|NODE]
As such, I was not doing anything strange or out of the ordinary.
It is worth mentioning that of the 8 seconds taken by MySQL/Galera to perform the failover, 6 were due to the HAProxy settings which had 3000 ms interval and 2 loops in the settings before executing failover.
Execution latency
The scope of this tests, was to identify the latency existing between the moment that application send the request, and the moment MySQL/Aurora take the request in “charge”.
The expectation is that the more the database will get busy, the longer latency will exist.
For this test I had report both results, the one coming from old test with small box and the new one with large box.
Small Boxes
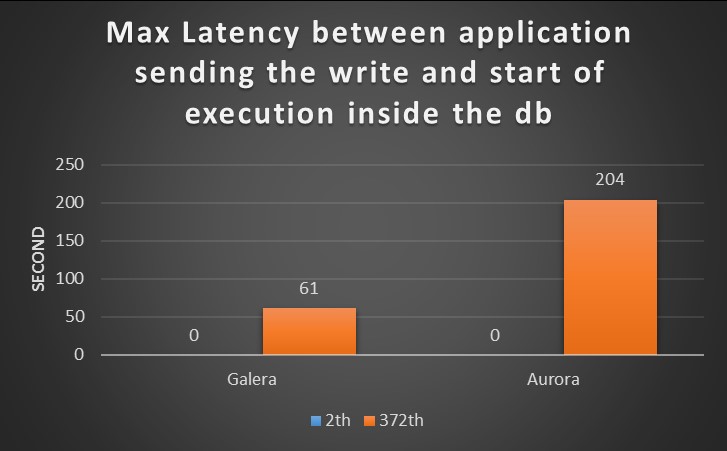
Large boxes
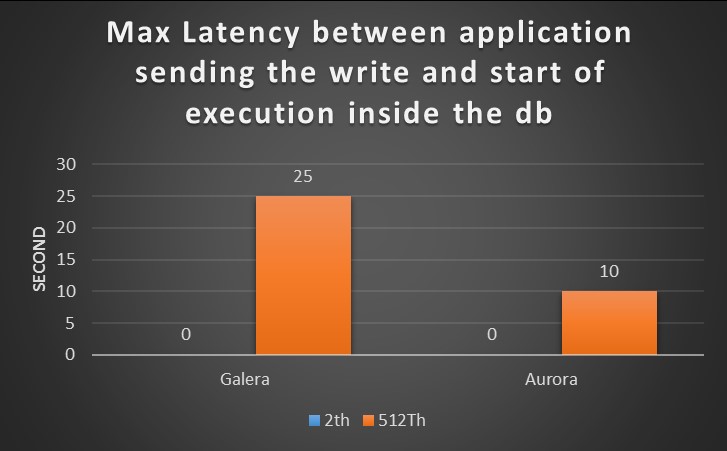
It is clear from the graphs that the two tests report a different scenario.
In the first Galera was able to manage the load more efficiently and serve requests with lower latency.
For the new tests, I had utilized higher number of threads than the ones for the small box, nevertheless in the second CPUs utilization and the number of running threads drive me to think Aurora was finally able to to utilize the resource more efficiently and the latency, just drop.
To mention, that latency was jumping up again when the number of connection was going above the 12K, but that was expected given previous tests results.
Conclusions
High Availability
The two platforms were shown to be able to manage the failover operation in a limited time frame (below 1 minute).
Nevertheless, MySQL/Galera was shown to be more efficient and consistent.
This result is a direct consequence of the synchronous replication, that by design brings MySQL/Galera in to not allow an active node to fell behind.
In my opinion the replication method used in Aurora, is efficient, and given data is shared across the read replicas, fail-over should happen faster.
I had suffered a lot during the tests because the connector, and I have the feeling that having another solution in place may bring some surprise, and actually I would really like to test that as well.
Performance
In this run of tests Aurora was able to invert the results I had in the first test with the small boxes. In almost all cases I had Aurora performing as well or better then PXC. There are still cases where Aurora is penalized and those are the ones where hotspots are present, and contention in Aurora is killing the performance, and raise errors (188). But I hope we will see a significant evolution soon.
General comments on Aurora
The product is evolving quickly, and benchmark results may become obsolete in very short time, this is why is important to have repeatable and comparable tests.
From my point of view, in this set of tests Aurora had clearly show where it fits better.
Critical applications that require High Available platform, and a lot of CPU power.
There is no reason to use Aurora in small-mid boxes, the platform is not going to be as efficient as a standard solution like PXC.
But if cost is not an issue, and the application really require a lot of parallelism, Aurora on db.r3.8xlarge is a good solution.
I still see space for improvements, like for cluster connectors, or the time taken to restart a cluster after a full stop, or contention reduction.
But I am also confident that the work lead by the developer team will fix most of my concern (and more) soon.
Final note, it would be nice to have the code open source, to have the community to contribute, also if I understand the business reasons for not to.